
We love metrics. The founders of mabl also founded Stackdriver, which was originally a SaaS solution to manage metrics, dashboards, and alerting at scale. Many of mabl’s engineers have managed operations for large scale, cloud-based applications. We rely on metric-based alerts to help us understand the health of our infrastructure and systems, and even wake us up in the middle of the night when there are problems. But for all our love for those measurements, we’ve come to accept the following facts:
- “Good” metrics are insufficient to prove that our application is healthy from a user perspective.
- “Bad” metrics are insufficient to prove that our application is unhealthy from a user perspective.
So, how do we prove that an application is (or isn’t) healthy from a user perspective?--with synthetic transaction monitoring (a.k.a. “Synthetics,” “Proactive Monitoring,” “Active Monitoring,” “Testing in Production”), which is defined as:
“...a monitoring technique that is done by using an emulation or scripted recordings of transactions. Behavioral scripts (or paths) are created to simulate an action or path that a customer or end-user would take on a site, application or other software (or even hardware). Those paths are then continuously monitored at specified intervals for performance, such as: functionality, availability, and response time measures.”
At mabl, we combine synthetics (delivered by mabl!) and metrics (delivered by Stackdriver!) to provide a comprehensive, real-time view into the health of our application. Here’s a quick overview of what we get from each.
Detecting user-impacting issues quickly
We use mabl tests (referred to as “synthetics” hereafter) to validate all of our key user journeys continuously in production and to alert us (via OpsGenie) upon failure. This detects issues faster than on metrics because our metrics vary based on day, volume, and other factors, which compels us to wait for several “abnormal” samples before alerting. Synthetics, on the other hand, are controlled; they behave the same way with the same results on every run, so we only need a single failure before alerting.
Let’s look at 5XX response codes on a relatively low-volume but critical part of the application (where we did not have any alertable incidents) over the past month: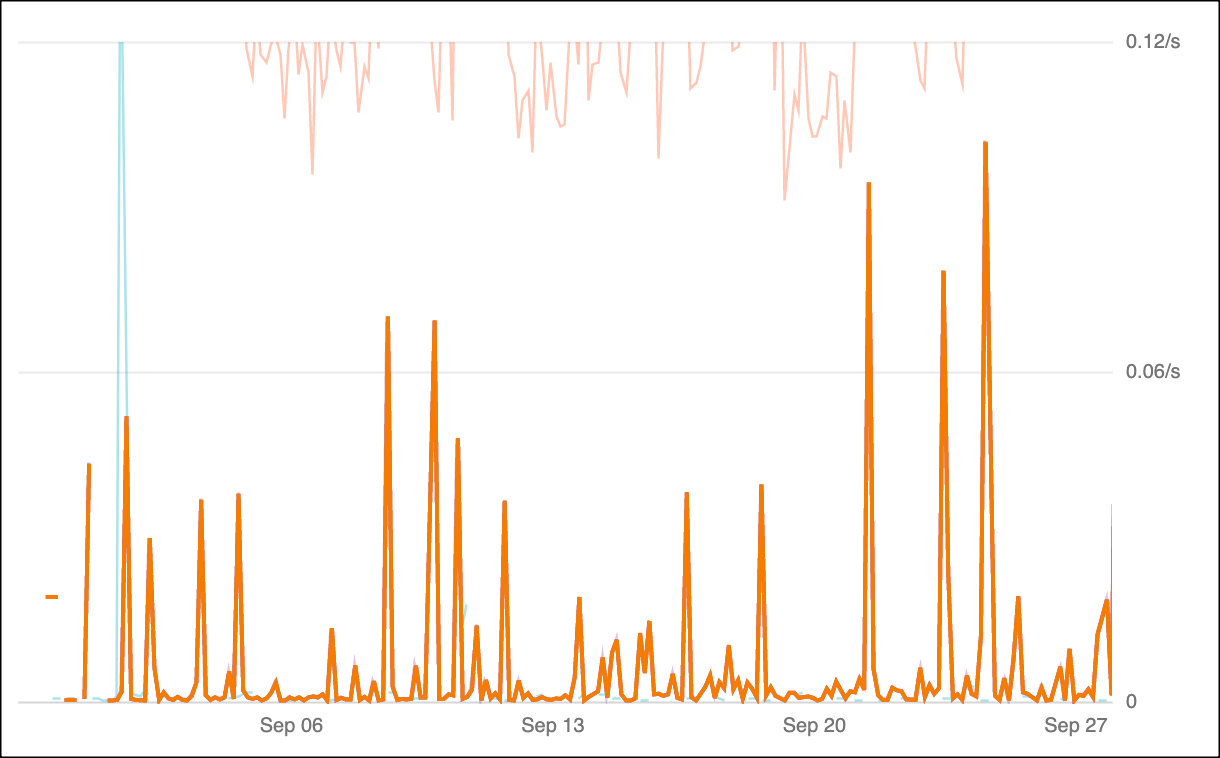
How would you craft an alert that detects an issue quickly? Wherever I set the threshold, given the spikiness in the rate, I’d be inclined to require two or more abnormal samples, which would be a mistake, because an incident could look like this:
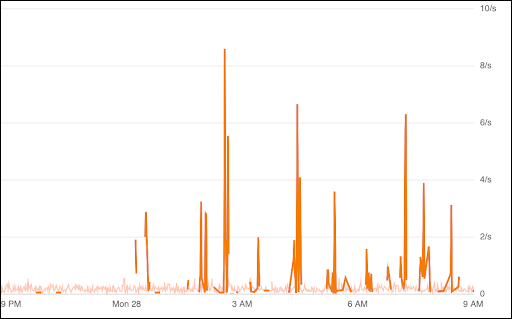
Notice that the spikes are several times higher than the spikes in the first graph. The first abnormal measurement was at 12:12 AM, but it wasn’t for another four hours that we had two consecutive measurements that you would classify as abnormal.
An effective test could have caught the issue 4 hours sooner than the metrics, because we would have tested the specific scenario that triggered the first error in a controlled and reliable way.
Detecting system or infrastructure issues quickly
While synthetics help us identify user experience issues quickly, metrics provide us with better visibility into the health of our systems and infrastructure. Using monitoring tools such as Google Ops and Datadog, you get real-time insight into your entire stack, whether you’re primarily concerned with capacity, uptime, utilization, errors, or latency. You can configure alerts to notify you when metric values or trends are abnormal, and you can automate some remediation actions (such as automatically replacing a cluster node that appears unhealthy).
Metric trending is also useful because, unlike synthetics, metrics can be predictive. For example, we can use metrics to alert us when systems are approaching their quota, whereas synthetics will continue to appear “healthy” until the moment when that quota is exhausted and the user is impacted.
Detecting application issues quickly
Aggregate application metrics and synthetics both play important roles in detecting application-level issues. Metrics from traditional Application Performance Management (APM) tools such as New Relic and AppDynamics are invaluable to detect changes in aggregate latency and errors at the application layer. It is critical, however, to couple these “inside out” metrics with “outside-in” signals.
Real User Monitoring (RUM) features add aggregate information about the health of the application as experienced by all end users. This is valuable for evaluating trends but less useful for real-time alerting given the downside of aggregate metrics noted above. Synthetics can add the real time “outside-in” view. While it could take considerable time to observe changes in aggregate metrics after a code deployment, for example, immediate triggers for synthetics can yield insightful results.
Diagnosing root cause
Understanding why an alert fired is as important as having reliable alerts. The first action an on call engineer will take, whether paged mid-workday or at 3 AM on a weekend, is to determine why the alert fired, so they can take the corrective action.
Typical metric alerts only tell you what was in error, such a high API latency, low disk space, or an unavailable server. The on call engineer must still use their skills and knowledge of the system to merge the alert with additional data to determine the cause.
Conversely, alerts based on synthetics retain rich test details captured during the failed execution. For example, with mabl tests, an engineer can simply click through the alert to the results, to immediately review screenshots, HAR network logs, and browser traces, reducing the necessary mental hops. Further, while monitoring metric alerts are a “wait and see if it recurs” approach, synthetics can be retried on demand to confirm or clear an error, such as mabl’s “Rerun” button on Slack alerts.
Limiting false positives
Since alerts will sometimes be erroneous, it’s important to understand how an alert can be incorrect. In statistical testing these error cases are called false positives and false negatives, or in plain English, reporting an outage when there is no outage, or reporting proper system operation when there is an outage.
Due to the breadth of samples available to a metric based alert, simply triggering off a single out of range sample, like an API 500 status code, will lead to many false positives from the perspective of an application user, especially if your UI doesn’t even use the affected API endpoint. Conversely, since a test based alert indicates that a critical user flow cannot be completed like processing a checkout, a single failed test can strongly indicate a problem with the system that is likely to be impacting the user experience. Overall, metric based alerts are more prone to false positives than test based alerts due to the coupling of test based alerts to real world user flows.
Limiting false negatives
The case of false positives is the inverse relationship discussed above. The higher the sampling frequency feeding an alert, the lower the risk of missing a sample that indicates an error state. Since metrics are often produced on the order of multiple samples per minute, or even many per second, a metric based alert can react quickly to a state change in the monitored application. Additionally, it is possible for a metric to consume all interactions with a system, such as every API call made.
Because test based metrics require running a full user emulating test to create a measurement, test based alerts have a granularity of 1-15 minutes. This lower sampling rate means meaningful impact can occur to the monitored application that goes unnoticed, falling between the taking of measurements, and increasing the likelihood of returning a false negative that a troubled system is in a good state.
How do you balance these opposing benefits of metric and test alerts for application monitoring? At mabl we combine them produce an accurate image of mabl’s system health, monitoring both our core REST APIs using metrics and our critical user flows using a rich mabl test suite.
Limiting up-front investment
The up-front investment required for monitoring depends significantly on two factors: the architecture of the thing being monitored and the scale of metrics collection and analysis. Infrastructure deployed to a major cloud provider will have access to integrated cloud-based monitoring and alerting services such as AWS CloudWatch or Google Cloud Monitoring. However, teams with infrastructure deployed on-prem will likely have to instrument their own scalable and reliable metrics collection systems. Regardless of where the infrastructure is deployed, it is often necessary to instrument or modify application code to generate the metrics that are indicative of application health.
The startup cost for synthetics can be quite low in comparison. Custom testing solutions can be built using a small cluster of machines that run tests on fixed schedules, on demand, or in response to events such as those created by CI/CD systems. SaaS testing solutions such as mabl can further reduce the initial time investment by managing the test infrastructure and scheduling, with the added benefits of easier test creation and maintenance, robust reporting, and rich diagnostic data as noted above.
Limiting cost of additional signals/alarms
The incremental cost of adding metrics is usually quite low once the monitoring system is in place. Code modifications may be necessary to add or modify, but these changes require little effort.
Adding a new test often requires a larger time investment than adding a new metric. Whether the test is written in code using a framework like Selenium or with a codeless test solution like mabl, the test author must take the time to ensure that the test is robust enough to trust its results. Although it may take more time to implement a new test compared to adding a new metric, tests can usually be developed by a greater number of people in a given organization--particularly if you use a low-code solution like mabl.
Limiting ongoing maintenance
The cost of ongoing maintenance for metrics varies based on whether a team is managing their own system for collecting and analyzing metrics or using a cloud-based service. Teams who manage their own metrics systems are likely to experience high infrastructure maintenance overhead, particularly as the volume of metrics being tracked--and thus the infrastructure to store, analyze, and store these metrics--scales. Cloud-based metrics do not require significant maintenance. In either case, there is, of course, some overhead associated with configuring alerts, dashboards, and so forth.
The overhead associated with synthetics depends on how often the application is undergoing significant changes and how resilient the tests are to change. Writing tests that will still function correctly as the application changes is not trivial, but many teams are able to achieve this result with sufficient planning and coordination between test authors and application developers. AI-enabled software testing tools like mabl can further reduce the amount of effort required by automatically updating tests as the application evolves.
So, should your team use synthetics or traditional metrics to monitor application health?
Generally, if you’re delivering a customer-facing application, you need synthetics as well as infrastructure, system, and application metrics to maintain a complete view of the health of your service. If you’re just getting started, we believe that it’s best to start with the key performance indicators for your business, and work backwards from there. If you have uptime targets as part of your KPIs, you're likely to want synthetics to demonstrate that uptime. If you have application-specific KPIs (such as transactions or sign-ups), you’re likely going to want to define counters for those via custom instrumentation within the application or via integration with your preferred logging service. In any case, starting with the KPIs will provide a forcing function so that you measure what matters.
Want to see for yourself how you can test and validate your key user journeys with mabl? Sign up for a free trial today!


