
If time is money, developer and customer time are invaluable. Accordingly, businesses get a significant value add from tools that accelerate development and improve the customer experience. This is why we built mabl BigQuery Export Feeds.
How mabl BigQuery Export Feeds Work
 BigQuery Export Feeds send a continuous, real time stream of journey outcomes directly to your BigQuery tables and BigQuery integrations like Looker
Using a mabl BigQuery Export Feed, you can:
-
enable real time custom reporting
-
make deeper analyses of testing patterns
-
take action immediately upon test completion
Let's look at how Export Feeds accelerate feature time to market while minimizing customer exposure to defects.
Custom Reporting
While mabl provides many plan and journey history views, we recognize that your application may benefit from bespoke reports that are unique to your business. Using the BigQuery Export Feeds, you can extract, transform, and view such reports in real time in tools like BigQuery and Looker.
BigQuery Ad Hoc Analysis
If you’re familiar with Google BigQuery, you can dive directly into the BigQuery UI and analyze the journey and plan data. You can also use the many analysis tools that integration with BigQuery, like Google Sheets, Data Studio, Tableau, and Looker (more on that in the next section).
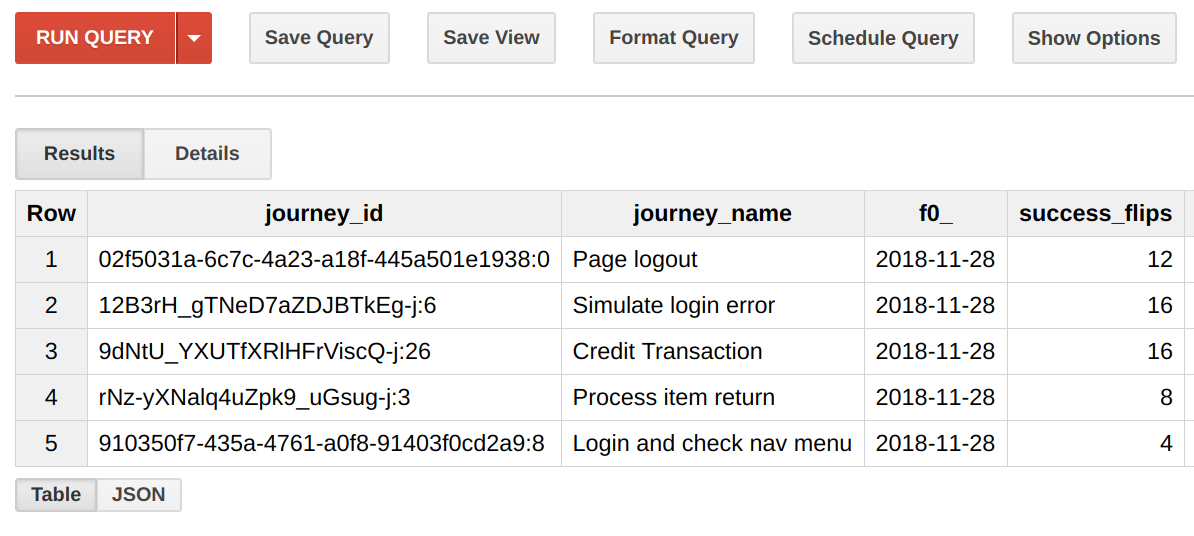
For example, let’s try to find all flappy tests in our workspace this week, using just a BigQuery Query. Using the following query and the LAG() function, we can easily do this using a state flip threshold of 3 flips.
-- Detect adjacent state flips SELECT journey_id, journey_name, DATE(start_time), SUM(IF(success!=previous_success,1,0)) AS success_flips
FROM ( -- Get success for journey, and it's previous run SELECT journey_id, journey_name, start_time, success, LAG(success) OVER (PARTITION BY journey_id ORDER BY start_time DESC) AS previous_success FROM [mabl_live_feed.mabl_journey_run] AS journey ORDER BY start_time DESC )
WHERE start_time >= TIMESTAMP("2018-11-22") -- one week look back GROUP BY 1, 2, 3 -- By journey, name and date
-- Return only journeys above our flapping threshold HAVING success_flips >= 3 ORDER BY 3 DESC -- by date LIMIT 5
Note: this query uses Legacy SQL for succinctness, but can be done in Standard SQL.
With this query, we've discovered five tests requiring attention because they have been flapping today. This is a signal for us to direct developers to investigate a possible application issue, so that we can minimize potential customer impact from an application bug.
Looker Live Reports
It’s simple to import data from BigQuery into Looker:
-
Enable mabl BigQuery Live Feeds to your BigQuery project
-
Make sure Looker can access your BigQuery project
Now we can make a simple BigQuery view to get our test feed. In this example our data is in the acme-bigquery project and mabl_live_feed dataset. Let’s select the columns of interest in BigQuery, as it’s much simpler than joining inside Looker (skip this if you’re a Looker ninja).
-
Add the following query to BigQuery and save as a view (e.g. live_feed_journey_plan)
SELECT journey.id, journey.plan_name, plan.application_name, journey.environment_name, journey.browser_type, journey.runtime_millis, journey.start_time, journey.success
FROM `acme-bigquery.mabl_live_feed.mabl_journey_run` AS journey JOIN `acme-bigquery.mabl_live_feed.mabl_plan_run` AS plan ON plan.id = journey.plan_run_id
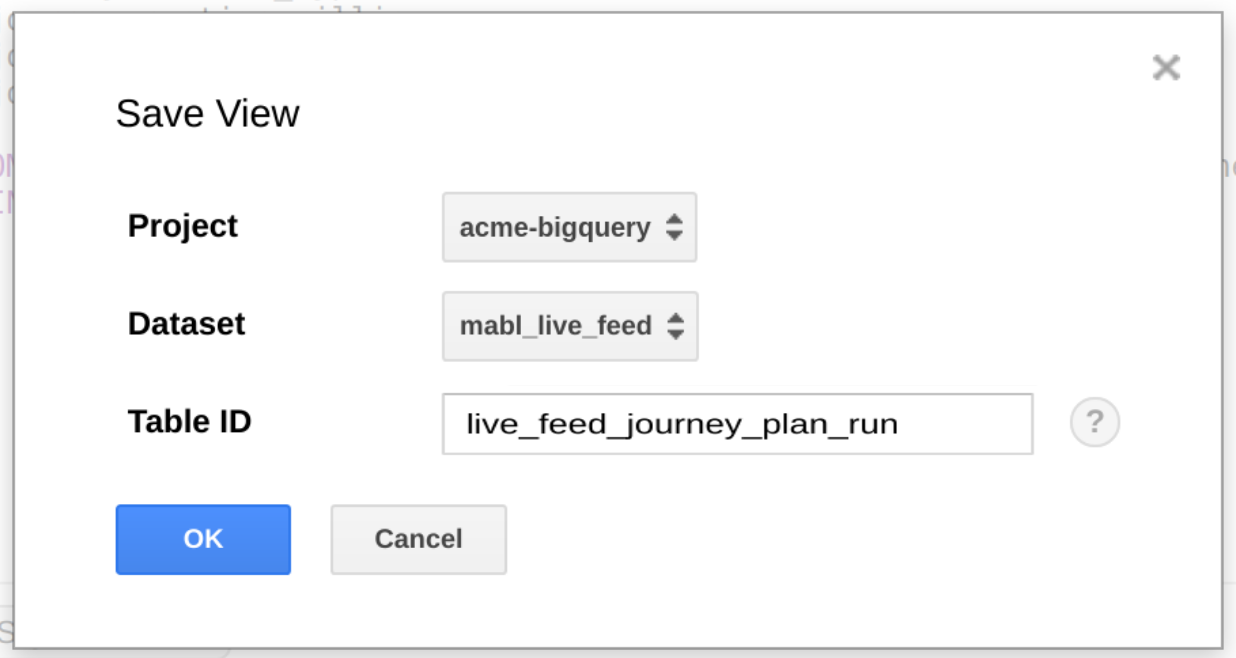 Optionally use a BigQuery view to simplify data access from Looker
Now we can automatically generate a model in Looker from this view.
-
From Looker, click Develop > <your-project>
-
Click the [+] next to Add… and select Create View from Table
-
Select the view from above (live_feed_journey_plan_run)
-
Click Create View
-
Save and commit your changes
The final step is to add our new model to the Explore screen, so people can work with it. This lookML fragment will expose our new view.
explore: live_journey_plan_run_feed { label: "Live Feeds" view_label: "Live Feeds" group_label: "App Data" }
-
Edit your model (acme_bigquery in this case), adding the above fragment
-
Save and commit
We can now explore the mabl live feed.
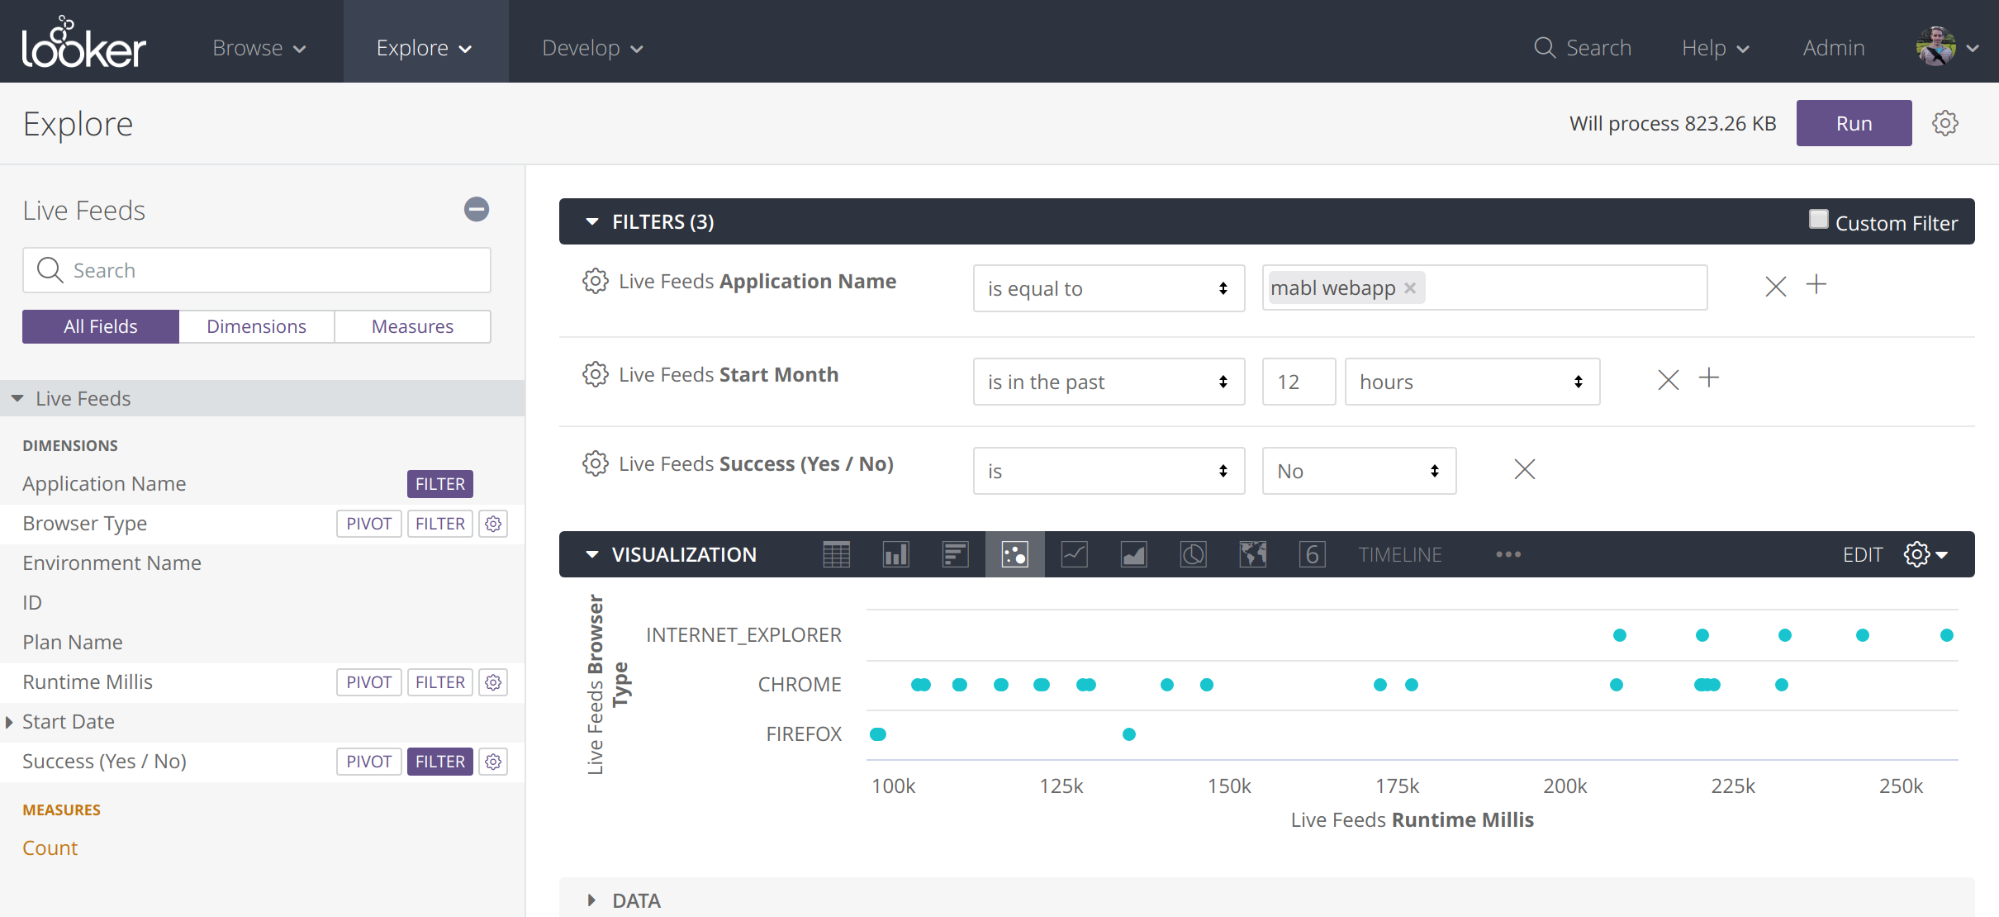 Looker Explore view for rapid ad hoc test result charting and drill down
In just one minute of pointing and clicking, we’ve got a new dashboard chart showing live runtime in the last 12 hours, grouped by browser, filtered by a given application.
The browser runtime insights are clearly apparent. We can see that Firefox is running consistently faster than Chrome, and that Internet Explorer is the laggard. The immediate take away is that developers should investigate the operation of your application in Internet Explorer before customers are impacted.
Dashboards
With a few more clicks, you can add your custom looks from above into a testing dashboard like the dashboard below.
Using features like custom filters, anyone in your organization, from testers, to developers to management can easily view and drill down into your mabl journeys as they happen.
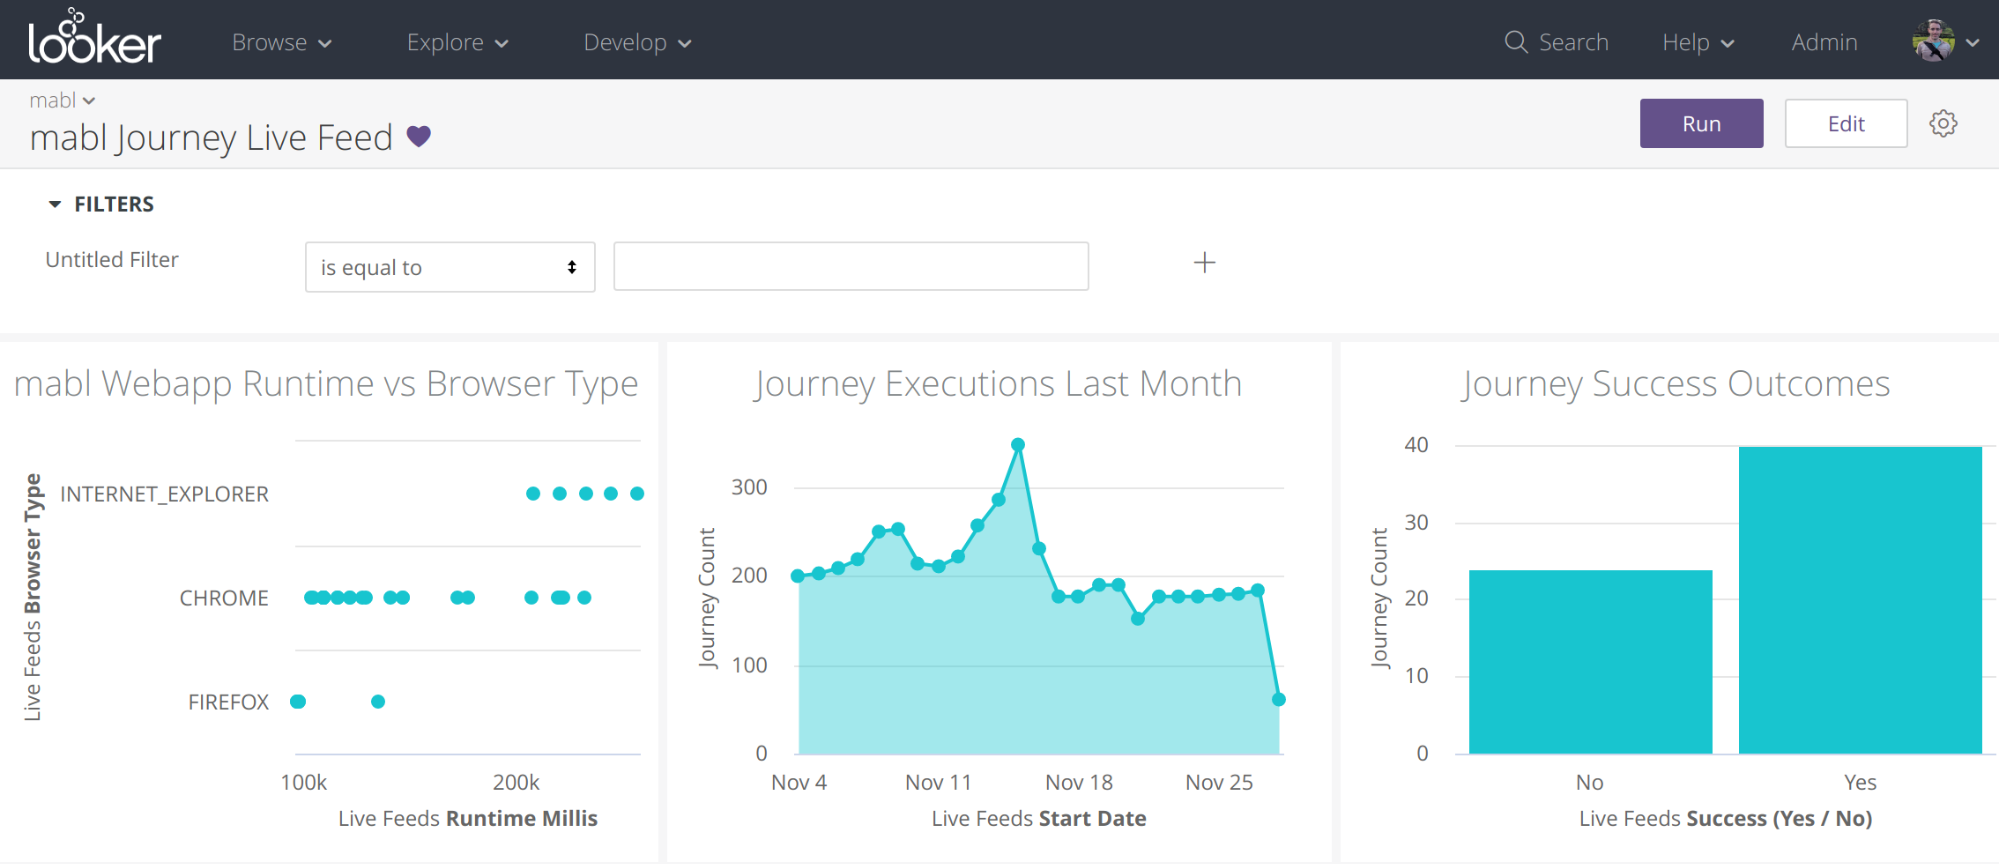 An interactive, real time test output dashboard with easy drill down
Conclusions
Combining mabl Live Feeds with Looker enables everyone in your organization to quickly and easily explore and derive insights from your mabl journeys, in real time. Removing the barriers to data sharing fosters insights generation across the organization, shorting the time from defect discovery to remedy and improving overall product velocity.


