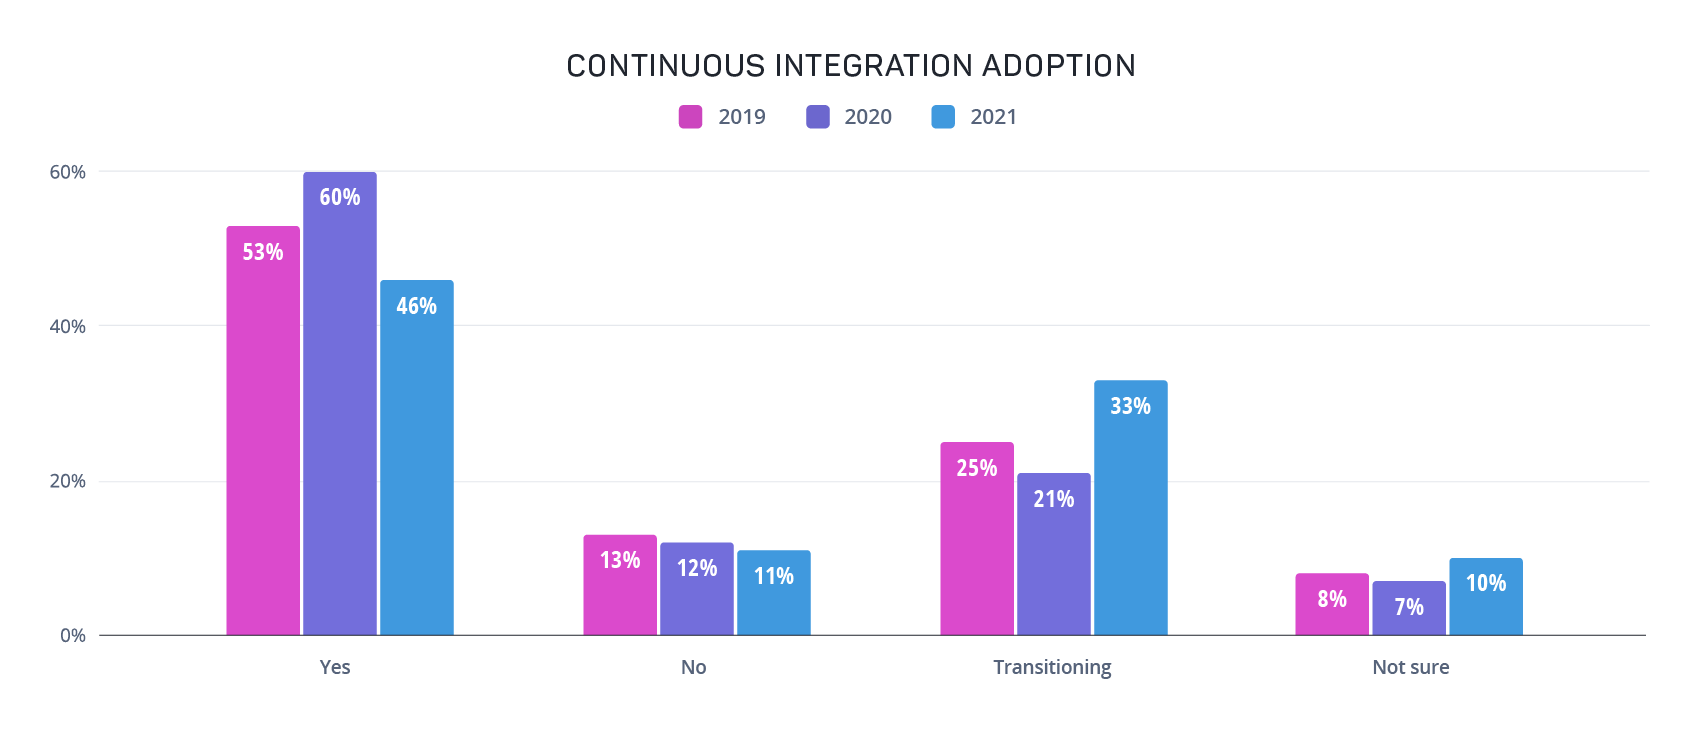
2021

The State of Testing in DevOps

A Message From Our Founders

When we left Google to start our next company, we spent months interviewing hundreds of software teams about the most significant challenges that they face. We weren’t surprised to find that most teams were focused on accelerating innovation by embracing agile and DevOps. But we were shocked by the number of teams that pointed to ineffective quality assurance as their primary obstacle. In fact, among our first 100 interviews, none reported that they were satisfied with their QA efforts.

book-thumbnail-ebook-state-of-testing-in-devops-23JUN2021

During those early sessions, we discovered an incredible tension between what modern enterprises wanted - rapid innovation and a world-class customer experience - and what their software teams were equipped to deliver. Indeed, the pace of development was accelerating as DevOps ushered in powerful automated pipelines, but QA was often sidelined in the adoption process. Instead, quality teams were stuck with outmoded manual processes and no viable options to effectively deliver the level of automation required in the DevOps era. 

We all recognize that as the experts on software quality and the user experience, quality professionals play an essential role in building market-leading products and services. Yet few test automation tools offered the insights, capabilities, and integrations to match the critical new role of quality assurance. Quality needs to be integrated into every stage of the DevOps pipeline, spurring the push to shift-left testing, and reshaping quality assurance to quality engineering for the entire product organization.

The past year brought unprecedented challenges. Software teams around the world shifted to hybrid or fully remote while endeavoring to maintain product velocity and quality. Quality professionals everywhere rose to the challenge as organizations rushed to expand, optimize, and improve their digital experiences.

This report shines a light on their experiences, how they adapted to pandemic conditions, and worked with the rest of their organizations to adopt DevOps, even as customer expectations evolved by the day.

Our research found that DevOps teams are increasingly differentiated by quality. Whether it’s a culture of quality that discovers bugs earlier in the development pipeline, less stressful release days, or happier customers, the ability to adopt and scale automated testing made a clear impact on the entire organization. In fact, mabl was created to support QA teams in this critical role as they develop, scale, and continuously improve their quality strategy, and we see many of the trends highlighted in this report among our customers as well.

This report is designed to take the pulse on testing in DevOps, connecting the testing and quality community to the latest in test automation, CI/CD adoption, and the customer experience. We thank the survey respondents, our Friends of mabl customer community, and of course, the reader for taking the time to explore the exciting world of quality engineering in 2021.

Sincerely,

Dan Belcher and Izzy Azeri, mabl co-founders

The Respondents

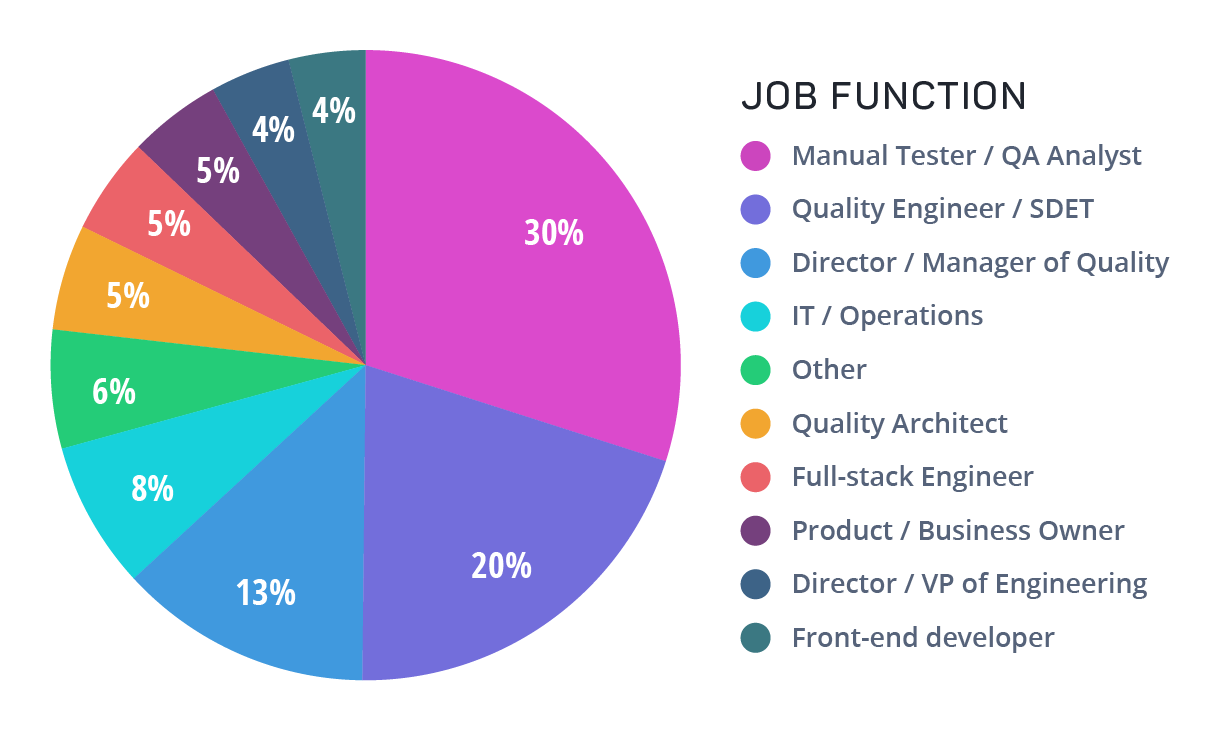
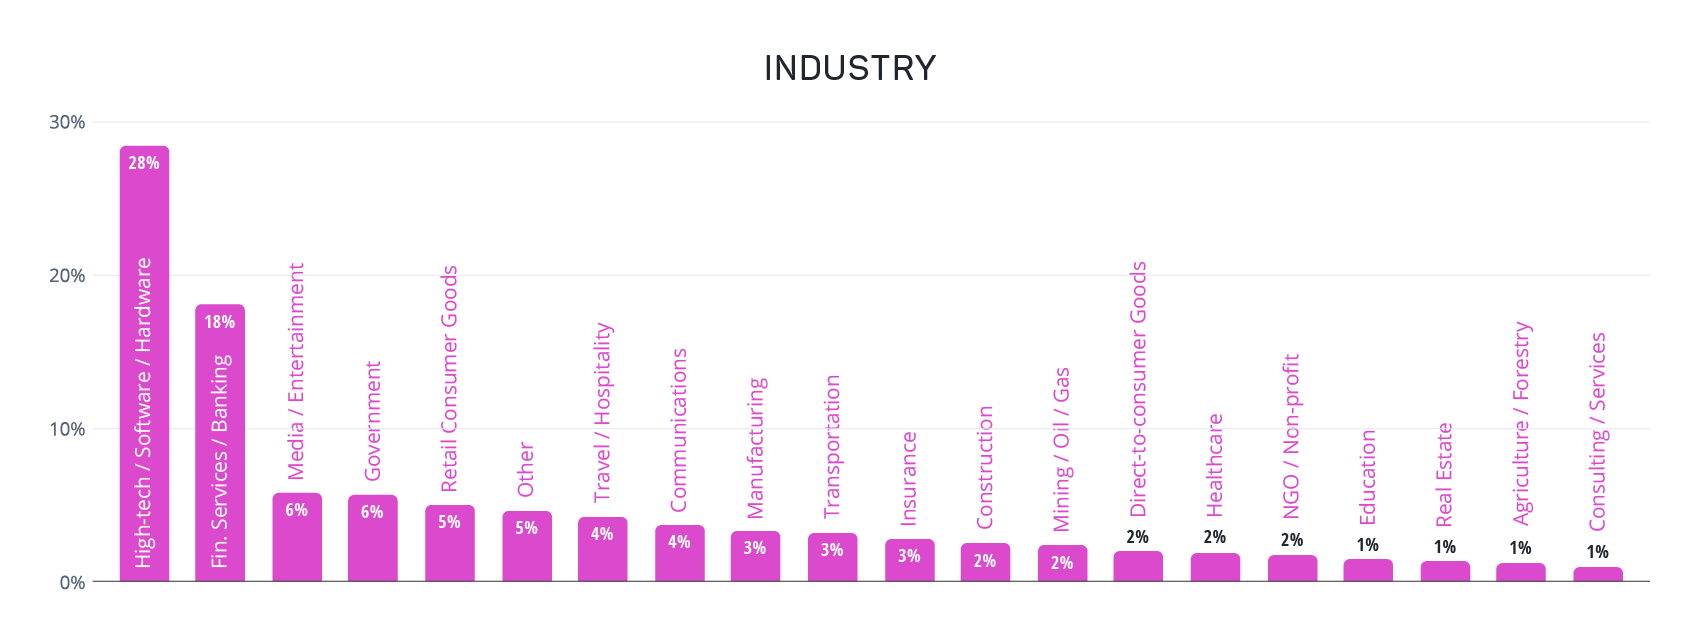
Over 600 professionals responded to our survey, with a broad range of quality and software development roles represented. The majority of respondents were those on the front lines of quality, including manual testers and quality analysts (30%), quality engineers or software developers in test (20%), or quality managers and directors (13%). The rest of respondents held various roles in product development, software engineering, and leadership positions.

Graph

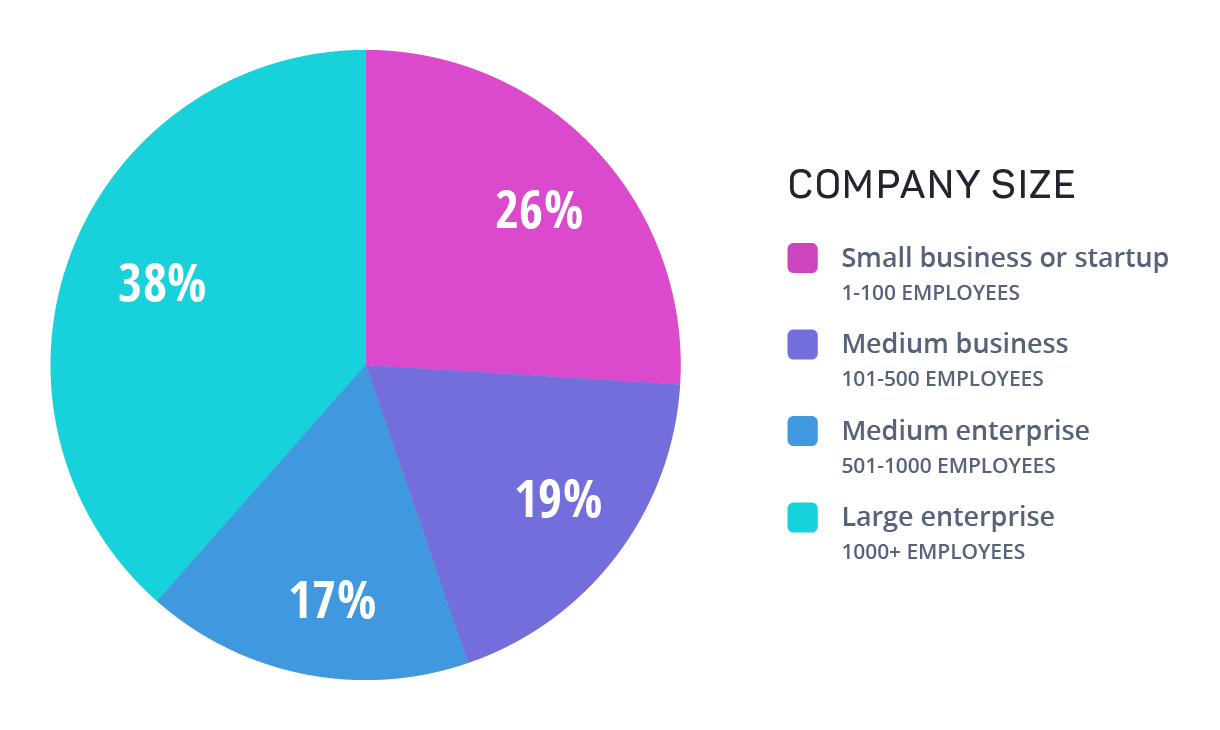
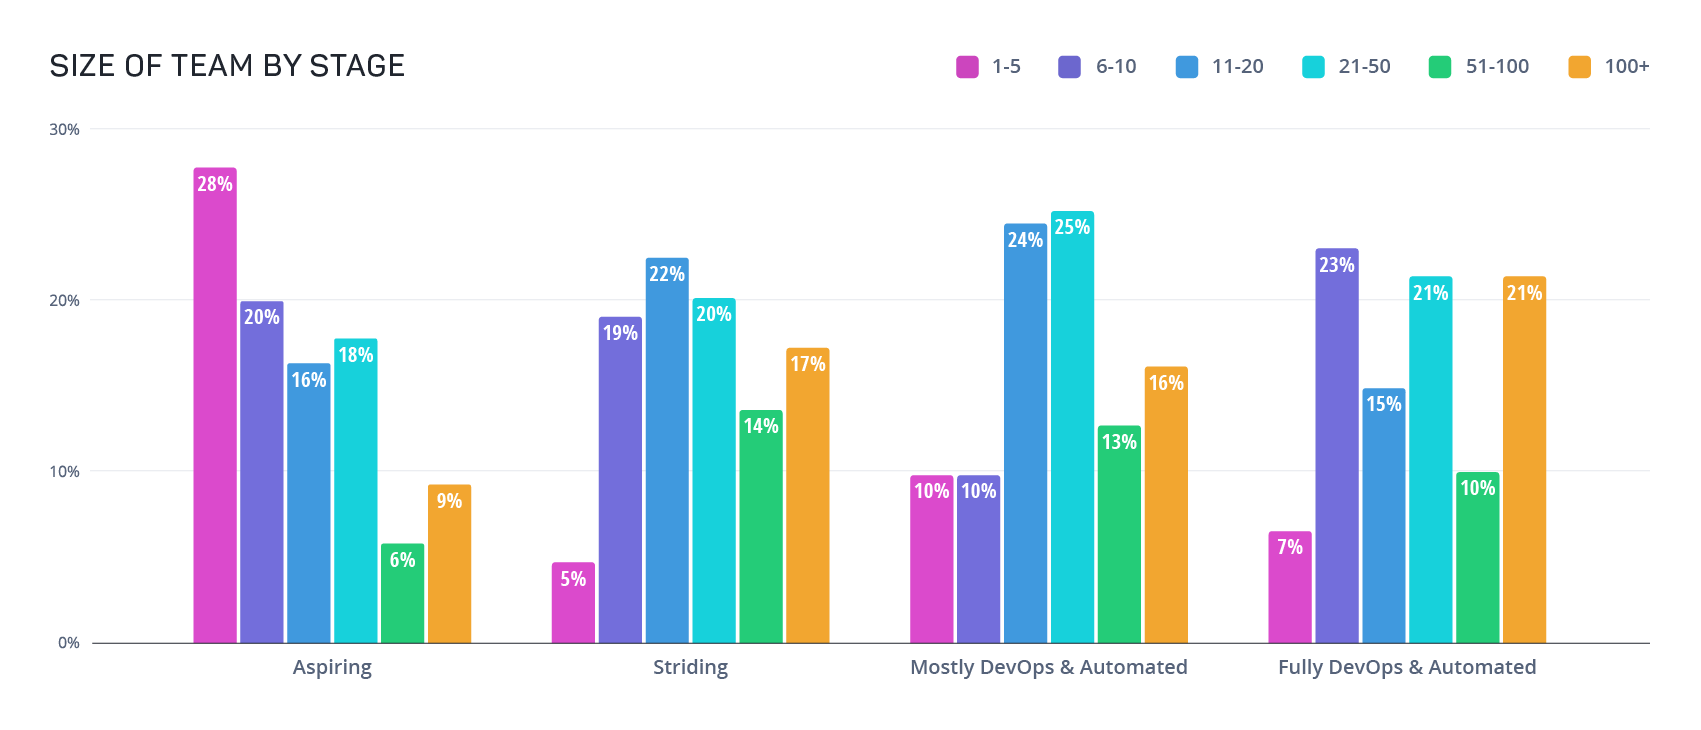
Survey respondents also worked in a variety of professional environments, giving us insight into how quality strategy and DevOps adoption are evolving in organizations of all sizes. The plurality (38%) reported working in large enterprises with over 1000 employees. Another sizable contingent (26%) was employed in small businesses or startups with just one to 100 people. Professionals at midsize organizations with 101 to 500 employees represented 19% of respondents, while those at medium enterprises with 501 to 1000 employees made up 17% of survey responses.

Graph
Graph

Survey respondents also reported working in a diverse range of fields, allowing us to gauge quality practices across industries. The largest group (28%) classified themselves as working in software/technology/hardware, with 18% saying they work in financial services or banking.

Other notable groups (roughly 5% each) include: media and entertainment, government, retail and consumer goods, as well as travel and hospitality.

The State of DevOps Maturity

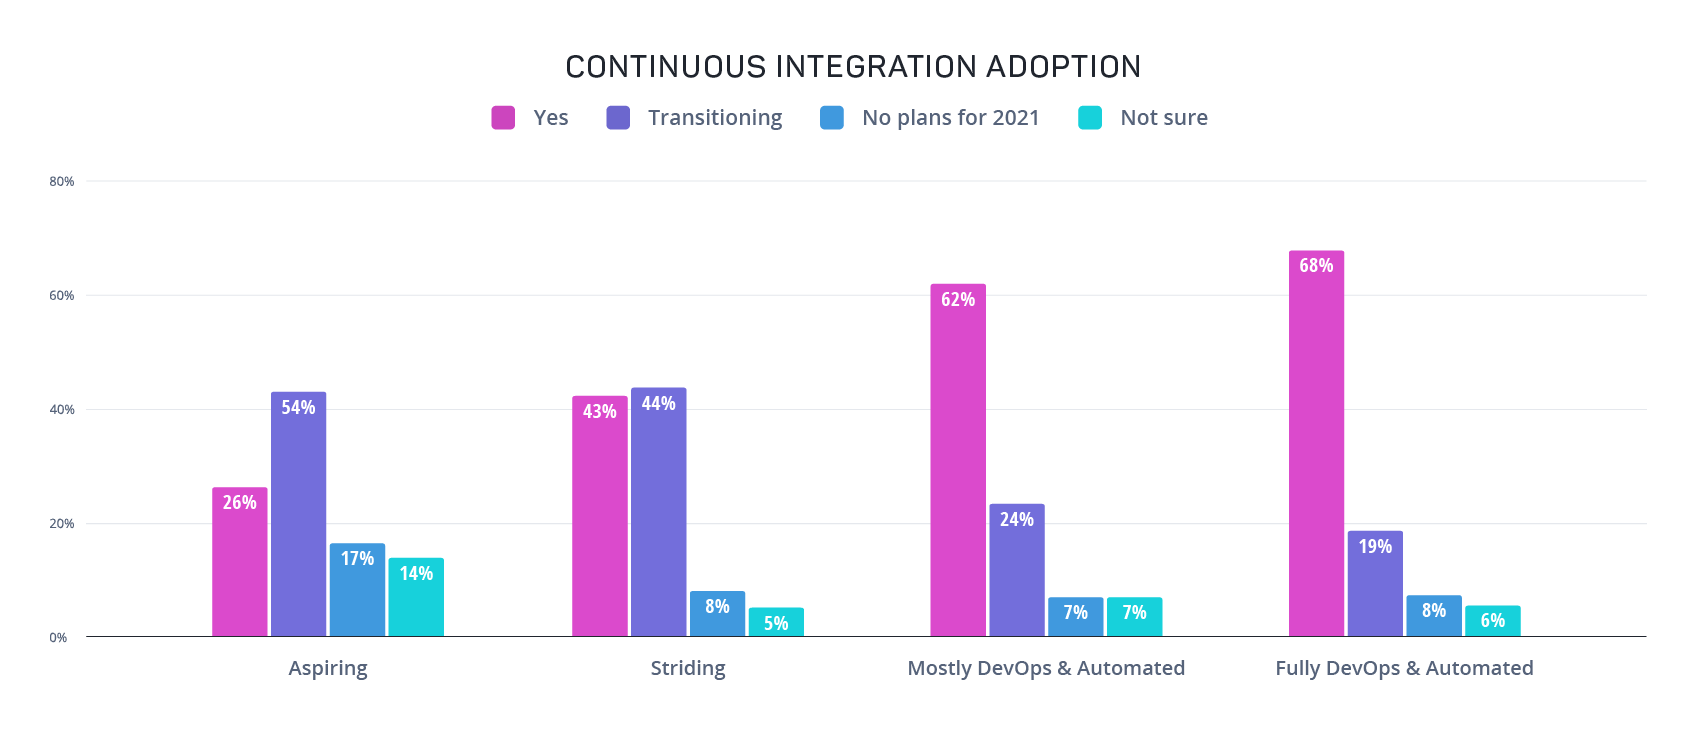
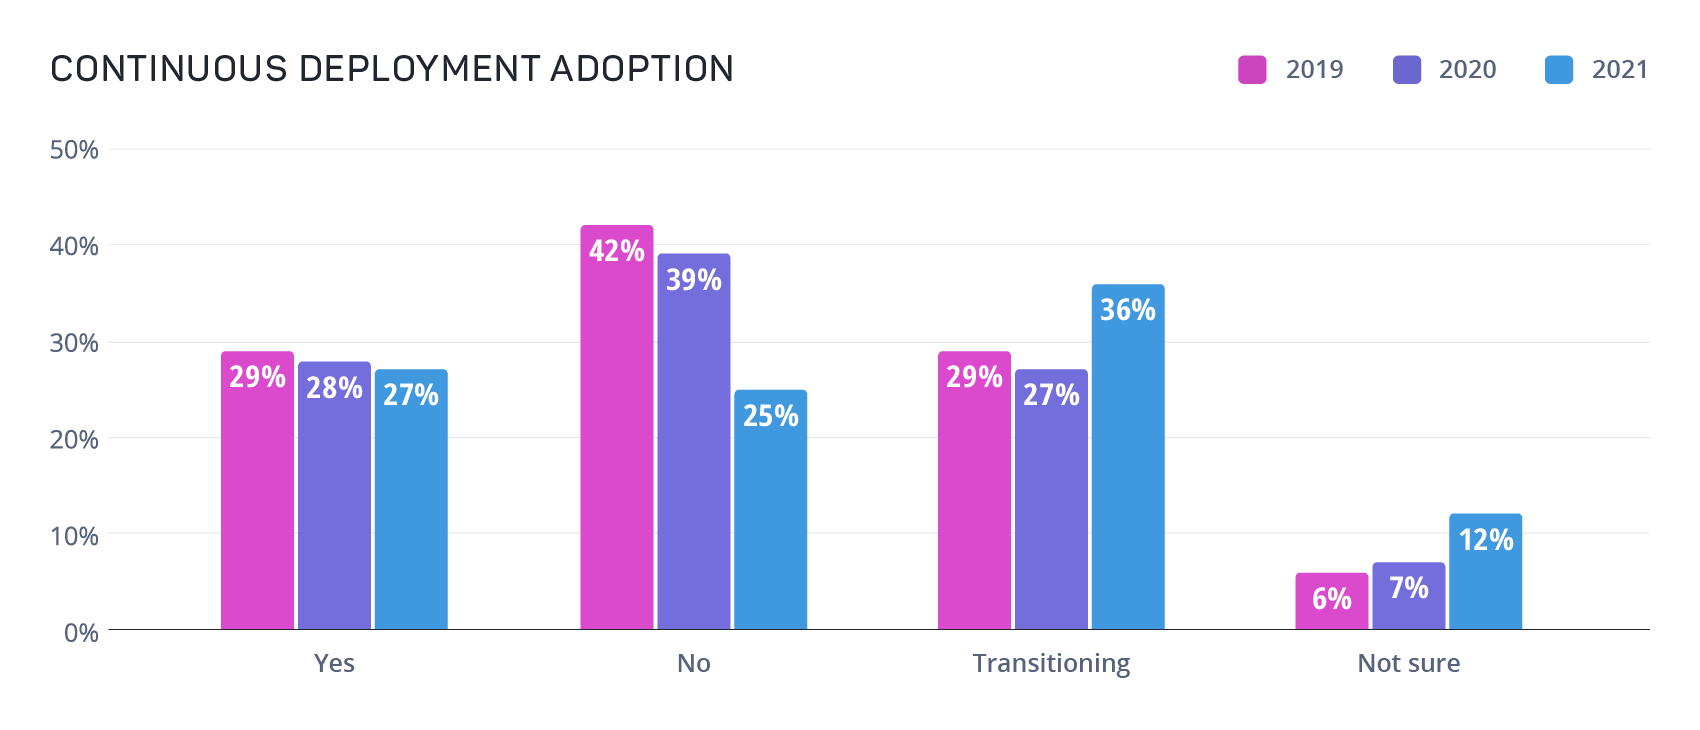
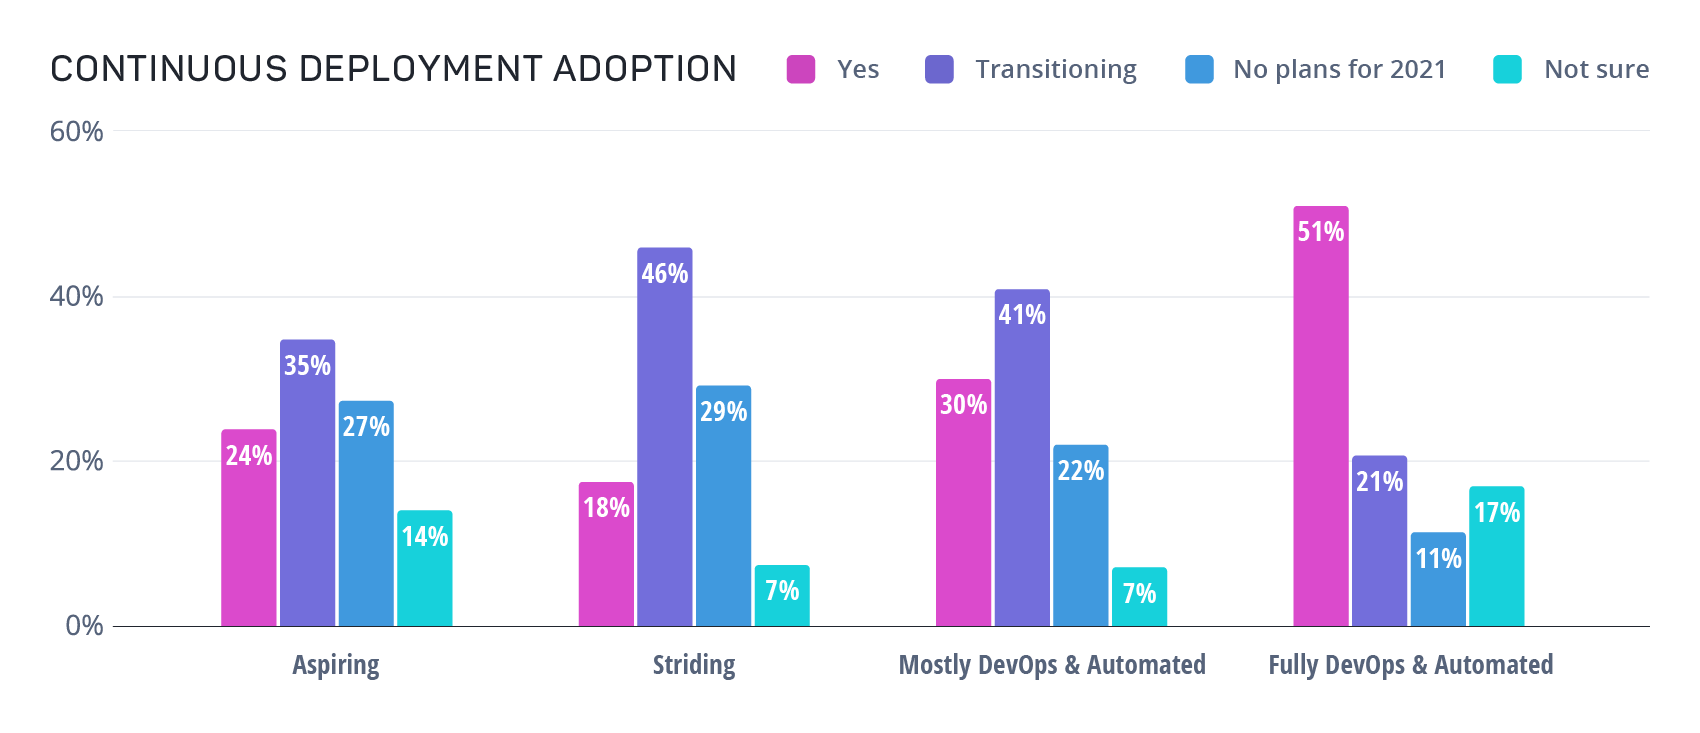
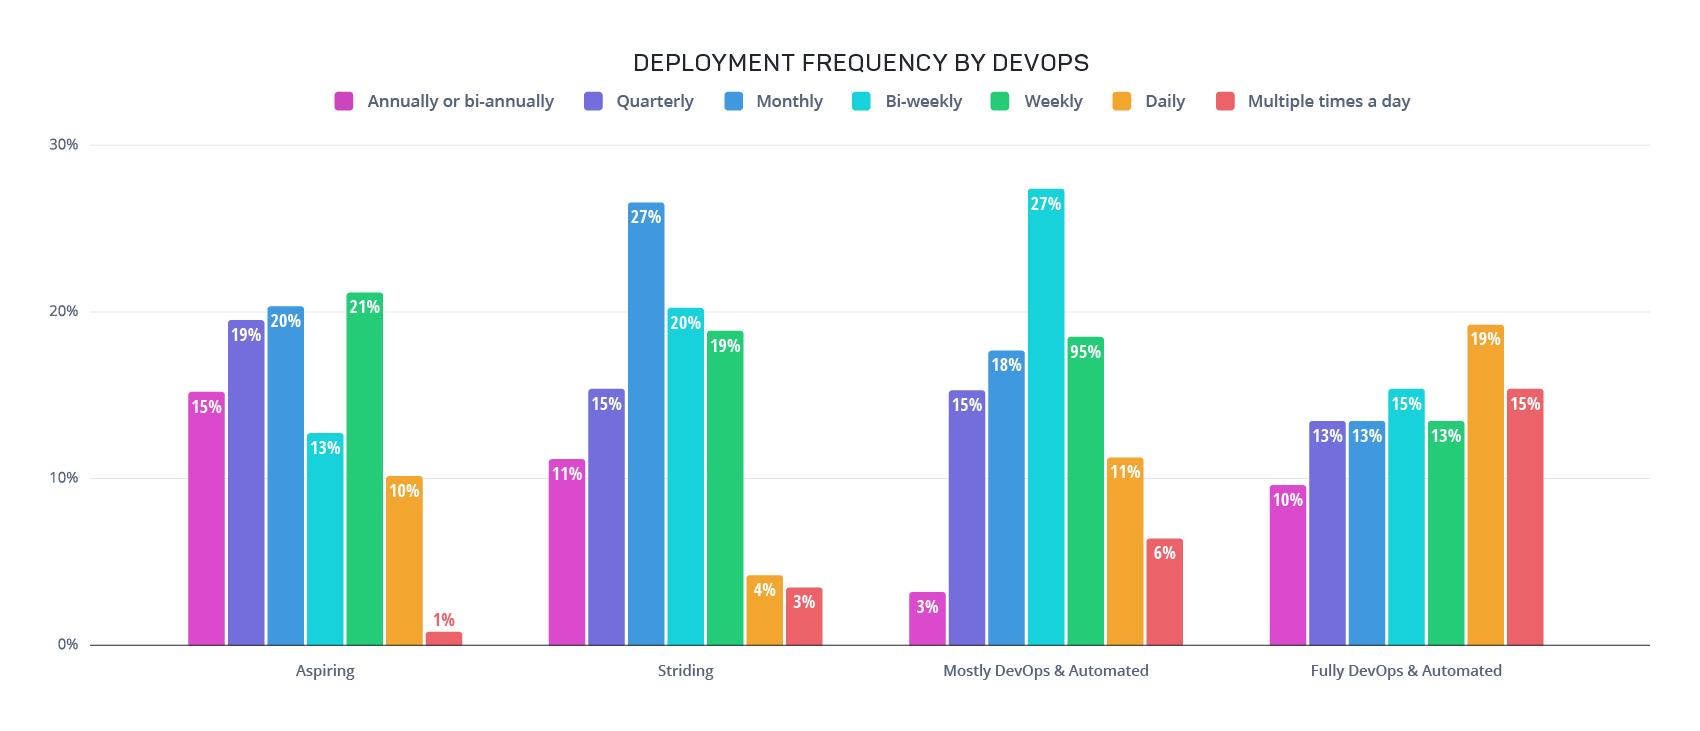
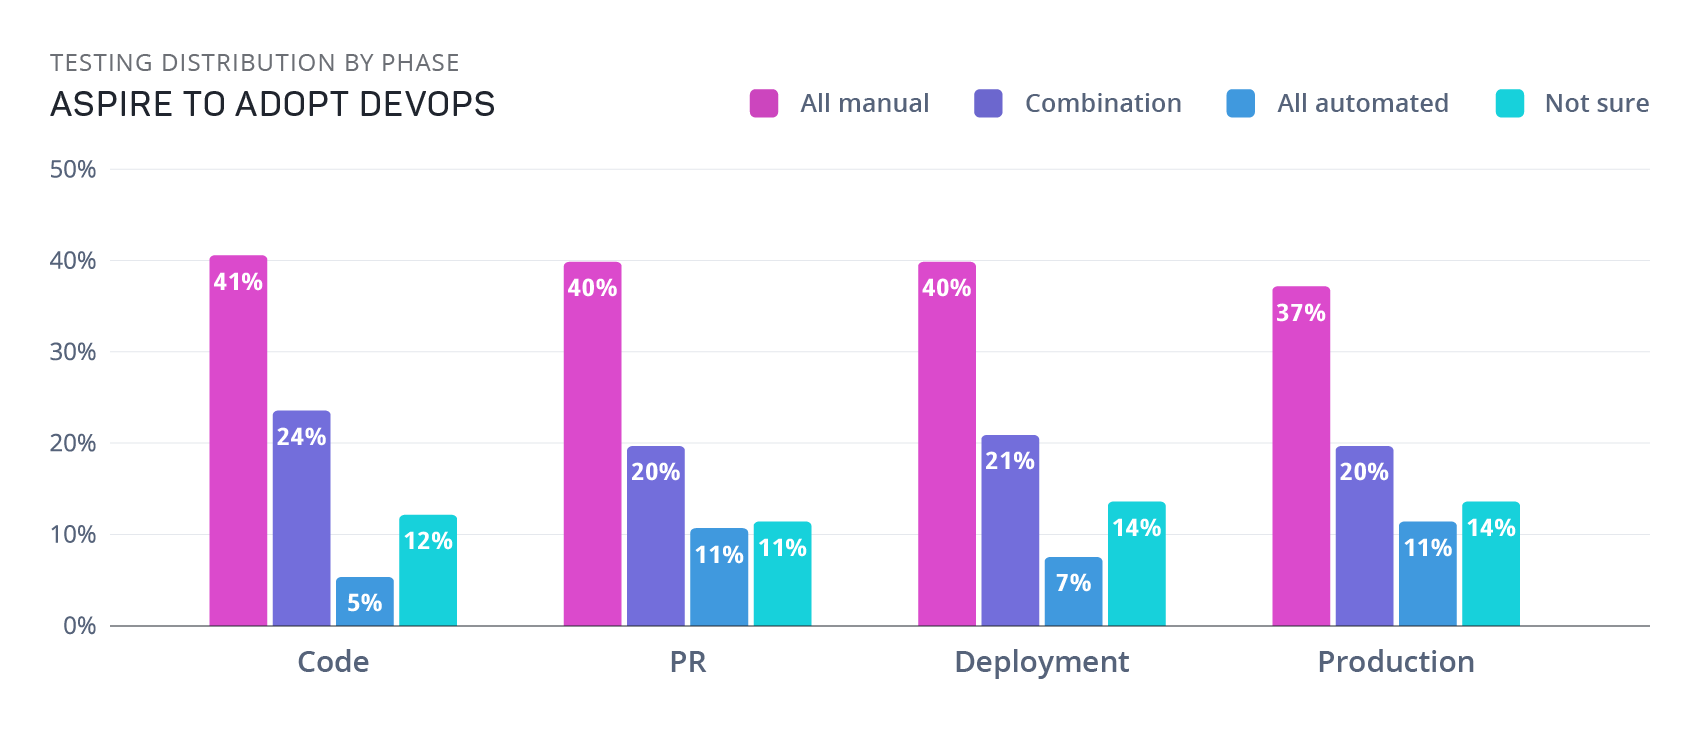
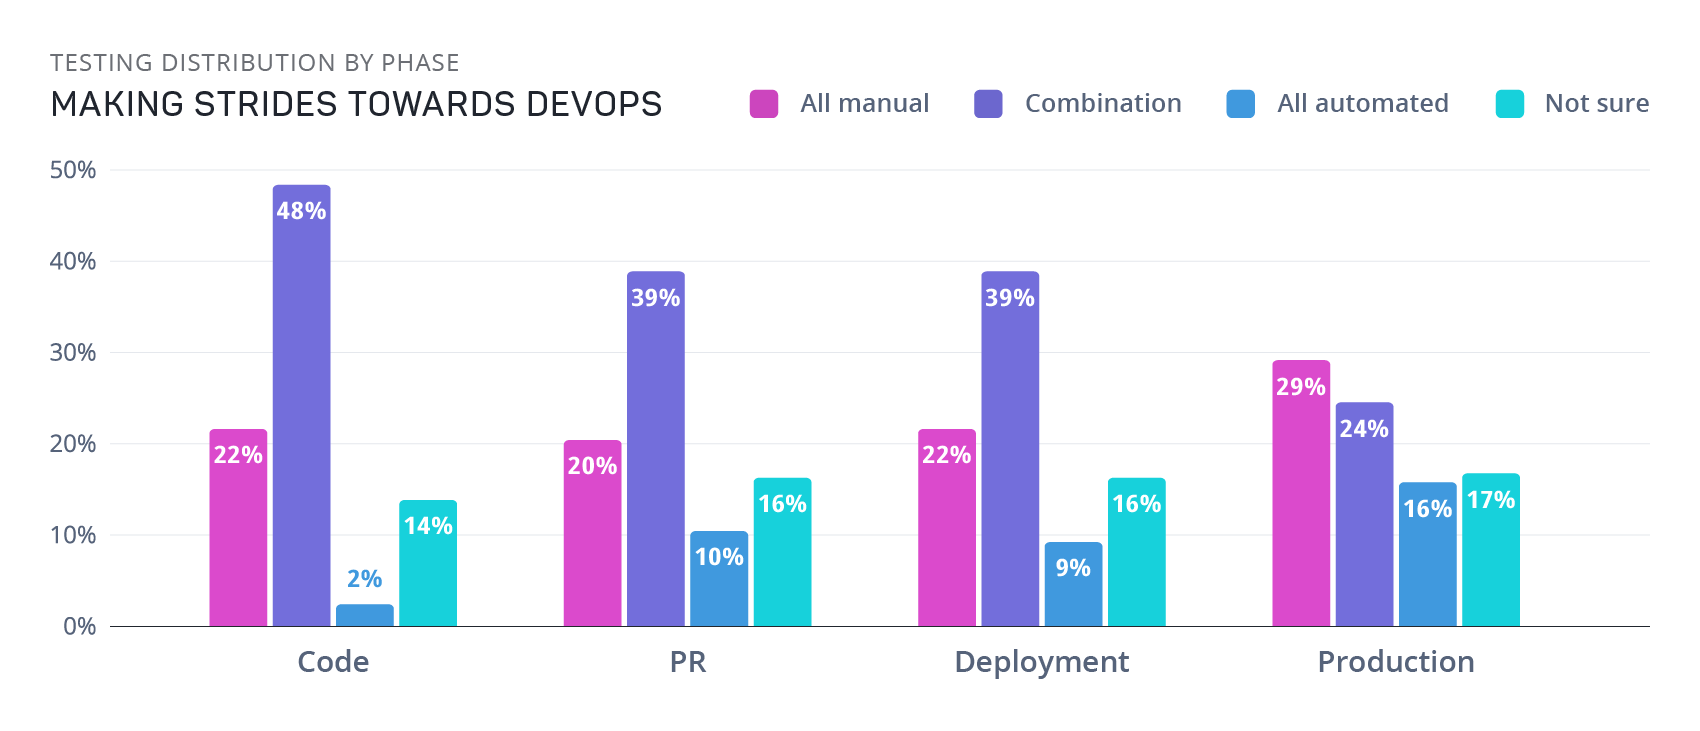
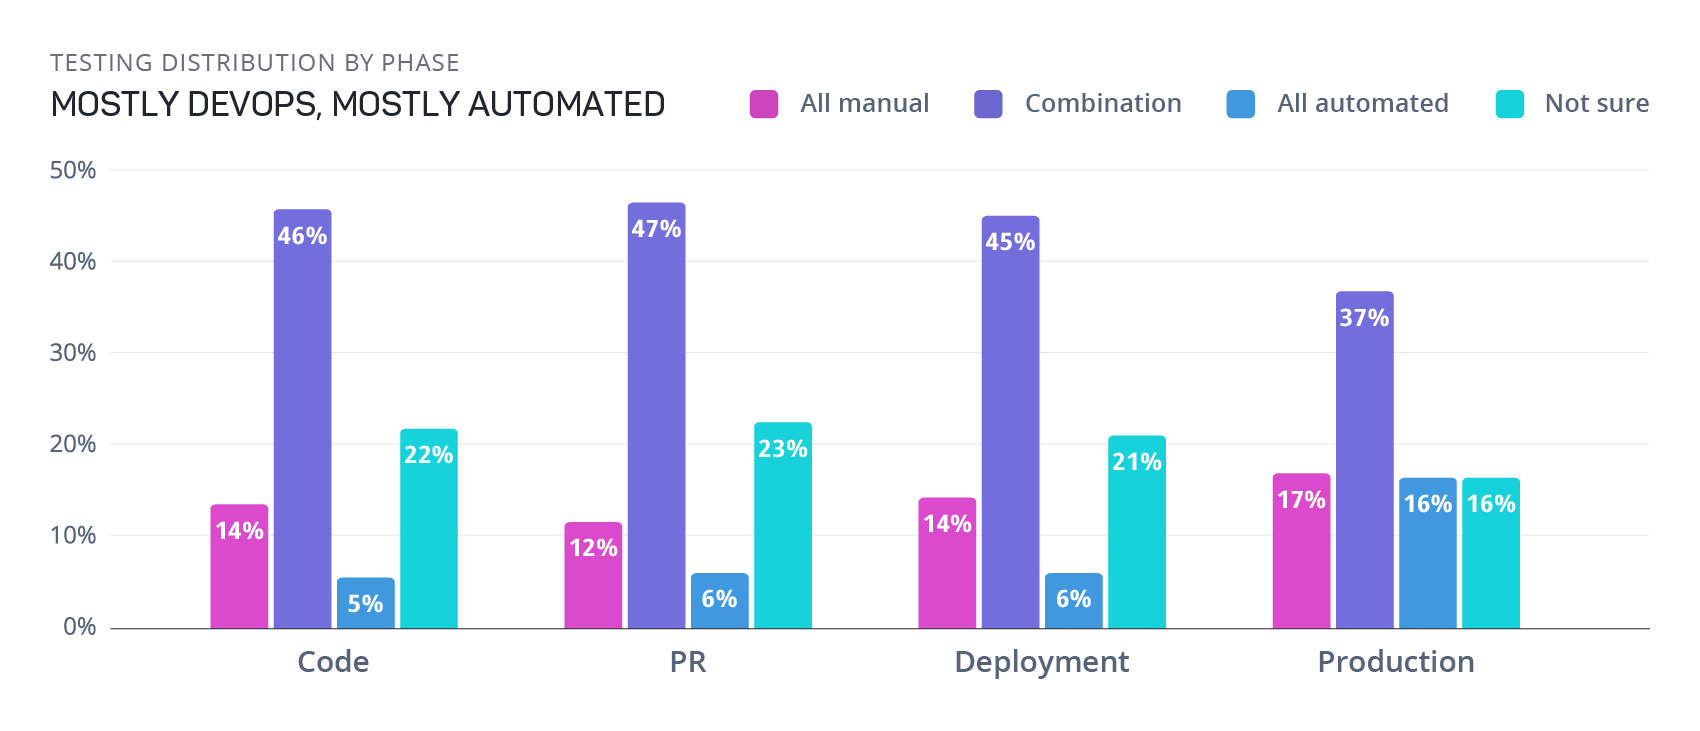
To set the baseline in DevOps trends, we asked respondents where they are in DevOps adoption. Adoption was relatively evenly distributed, with 28% of participants indicating that they’re making strides towards DevOps adoption. One-in-four participants reported aspiring to adopt DevOps, but still relying on manual deployments to put updates into production.


Graph

A similar number (24%) said their team had almost fully adopted DevOps with a mostly automated software development pipeline, and just 11% of respondents reported that they were running full DevOps with complete, or nearly complete, automation implementation in the development pipeline. A notable group (12%) indicated that none of these stages applied to their organizations. The near-even breakdown of DevOps adoption stages allows us to understand the challenges that persist at every level of the DevOps journey, particularly when it comes to test automation and software quality.

Those that aspire to adopt DevOps represent the status quo with manual deployments processes and varied development frameworks, while those in the midst of their DevOps journey illustrate the changes and obstacles that need to be overcome to embrace full automation on a DevOps team. On the other end of the scale, fully DevOps teams with completely or primarily automated development pipelines show us how quality and software testing transform under DevOps.

Distribution of DevOps Adoption Across Different Sized Companies

Interestingly, company and team size had little connection to the stage of DevOps adoption. No single category appears to lead the pack, though over one-third of small businesses and startups say they aspire to adopt DevOps, compared to 18% that say they’re making strides towards DevOps adoption and 13% that are mostly DevOps. Small organizations with full DevOps adoption followed closely at 12 percent.

In contrast, medium businesses and medium enterprises were dominated by those in the middle of DevOps adoption, either making strides towards DevOps or already mostly DevOps. Large enterprises with over one thousand employees had a significant number of DevOps aspirants, with one-in-four holding off on starting their DevOps journey.

Graph

Team size also proved to be a limited factor in predicting the stage of DevOps adoption. Though the smallest teams (1-5 people) were more likely to be in the aspiring stage, progress across the striding, mostly, and fully DevOps stages was relatively even, regardless of team size.

The most notable trend is how evenly distributed full DevOps adoption is: regardless of organization size, roughly 10% of respondents reported being running full DevOps with automated pipelines.

This indicates that DevOps is equally achievable for teams and organizations of all sizes, with DevOps and automation technologies accessible to the full range of businesses. The low number of early adopters also means that there’s ample opportunity for those early in their DevOps journey to catch up to the leaders. Even those who aspire to adopt DevOps, but have yet to begin the process, are still on a relatively level playing field when it comes to modernizing their software development pipelines.

Graph

Culture, Process are the Biggest Roadblocks

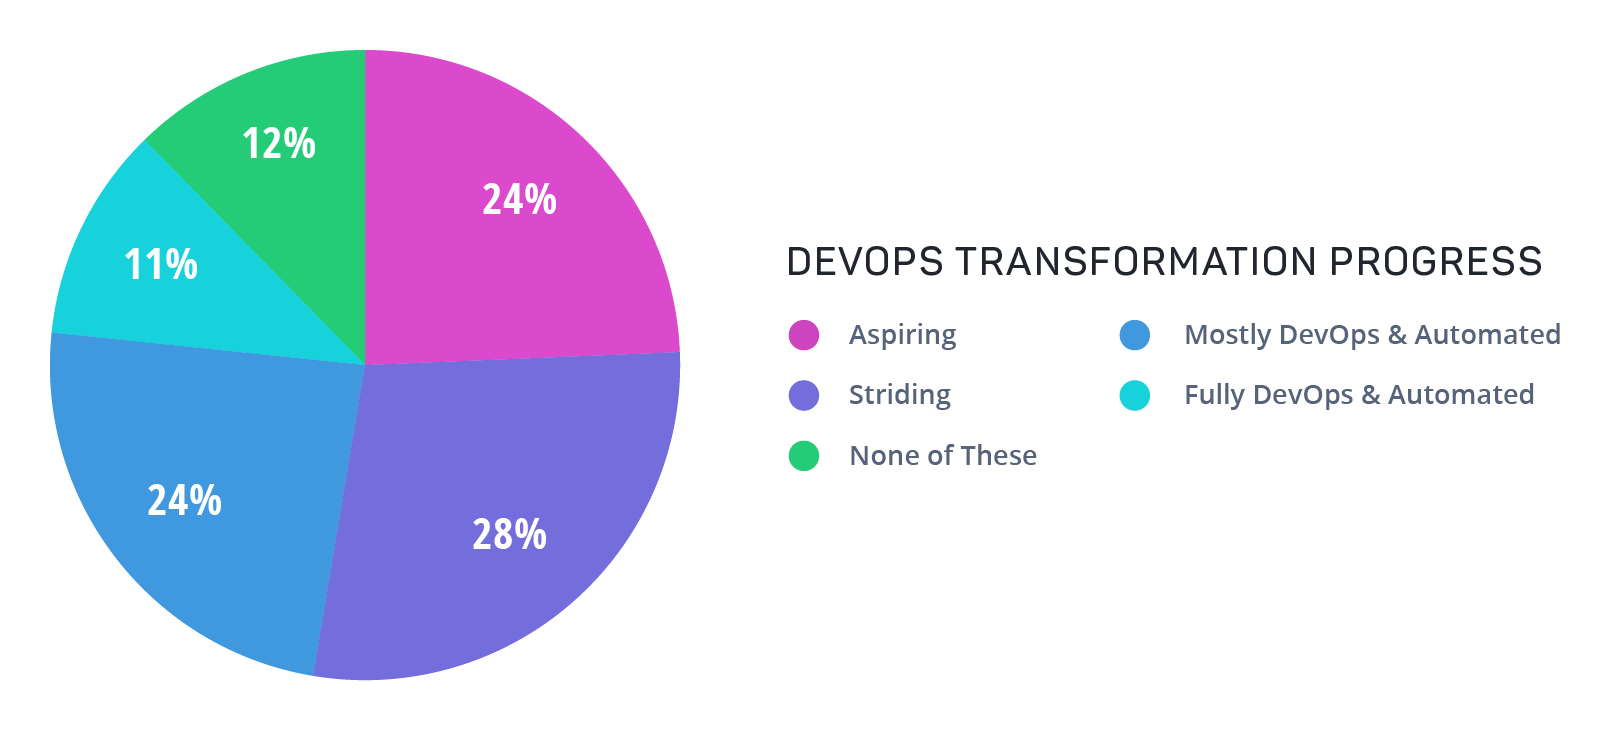
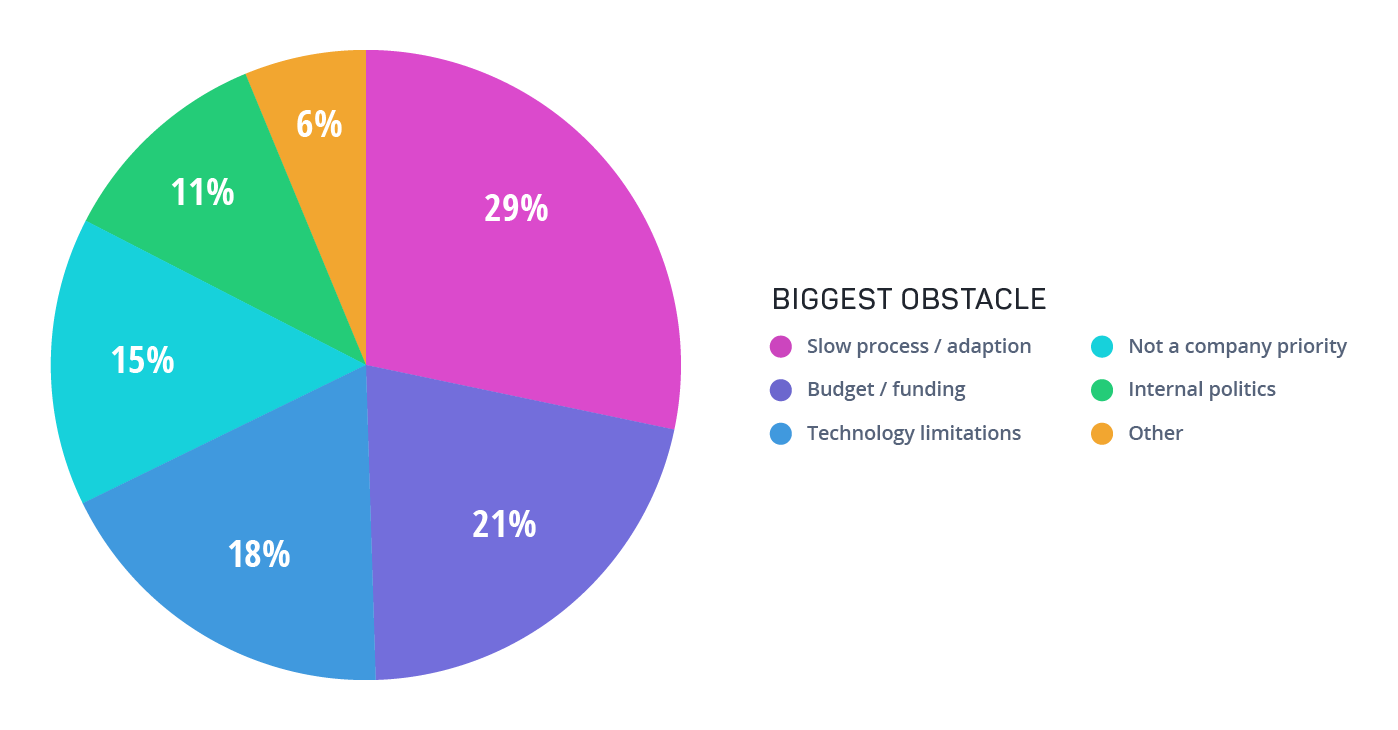
Unsurprisingly, significant roadblocks remain in the way of full DevOps adoption with completely automated development pipelines. But as the democratization of DevOps adoption indicates, technology is no longer the biggest challenge: a whopping 82% of survey respondents named non-technological issues as the main inhibitor to DevOps.


Graph

Instead, 29% of quality professionals list slow processes and a reluctance to change as their biggest challenge, with 1-in-5 respondents saying budget and funding are the most significant obstacles. The fact that 82% of software professionals no longer consider technology a major obstacle in DevOps adoption signals a key turning point in the implementation process.

With the growing range of tools specifically designed for DevOps and agile teams, the core problems that need to be addressed by stakeholders are how to manage the transition over a long period of time, as well as how to best allocate their budgets for maximum impact and ROI.

Shift in CI/CD Adoption Signals Changing DevOps Priorities

Next, we wanted to understand how DevOps and aspiring DevOps teams are adopting practices like continuous integration, continuous delivery, and continuous deployment into their software development pipelines. This allows us to gain insight into how DevOps teams are putting the principles of DevOps into practice: if DevOps is the map that guides the shift to integrated development and operations teams, CI/CD/CD are the pathways that allow teams to reach their destination through ongoing automation and data gathering.

The most commonly adopted principle was continuous integration, despite a 14% decline compared to 2020. The drop nearly matches the increase in those transitioning to CI, which jumped from 21% in 2020 to 33% in 2021. Most notably, CI implementation was strongly correlated with DevOps adoption, as the overwhelming majority of fully DevOps or nearly DevOps organizations (68%) indicated that they have implemented continuous integration.

Graph

CI is central to delivering quality in DevOps. By automatically performing unit tests when the source code is changed, testing is shifted to the left and moved away from the traditional model of testing only right before deploying to production. 

The rise in teams transitioning to CI aligns with a focus on software quality and automation that appeared in other DevTestOps trends that will be discussed later in this report.

Graph

A distant second to Continuous Integration is Continuous Delivery. A plurality of respondents said they’re in transition to Continuous Delivery (38%), while nearly the same percentage have already adopted it.

Like CI, Continuous Delivery is also closely connected to DevOps maturity, with those at nearly full DevOps or full DevOps the most likely to have adopted CD.

Graph

The pandemic also appeared to shift focus to CD adoption. In 2020, we found that 28% of respondents were transitioning to Continuous Delivery, while 38% of survey participants reported doing the same in 2021.

Graph

In the same vein as Continuous Integration and Continuous Delivery, Continuous Deployment implementation is correlated to DevOps adoption.

A team enabled by DevOps is far better positioned to adopt CI/CD/CD, either as separate initiatives or connected plans. 

Graph

As we identified earlier in the report, tooling is not the biggest inhibitor to DevOps. Teams have the tools they need to do the job. We had asked respondents which tools they relied on to support their CI/CD efforts.

GitHub and Jenkins lead the pack, making up 69% of reponses, with alternatives fairly evenly distributed among a handful of other solutions.

Graph

Teams Maintained Product Velocity Despite the Pandemic

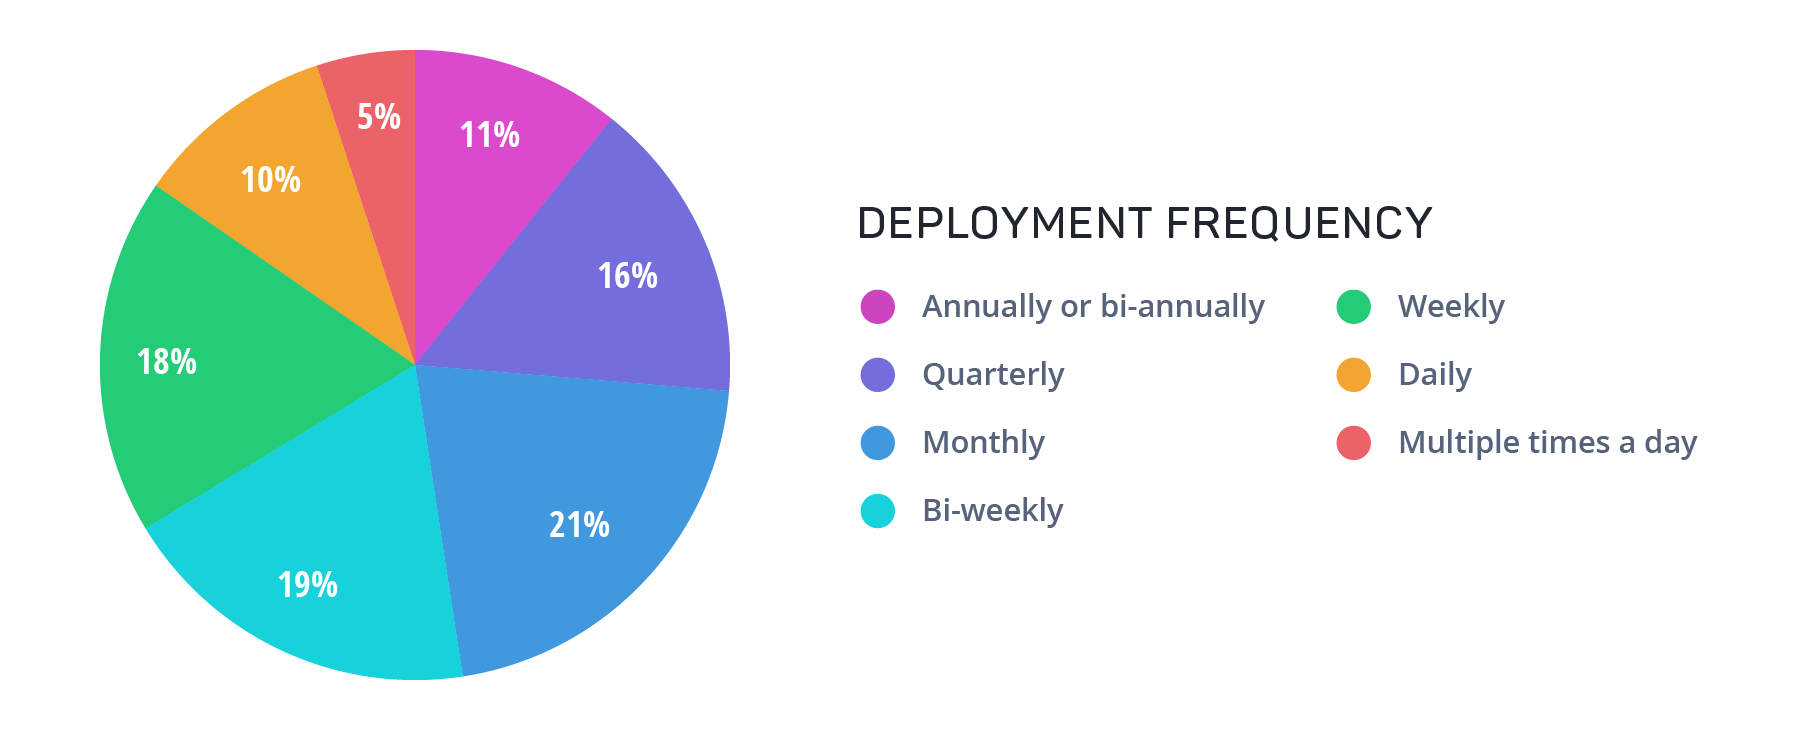
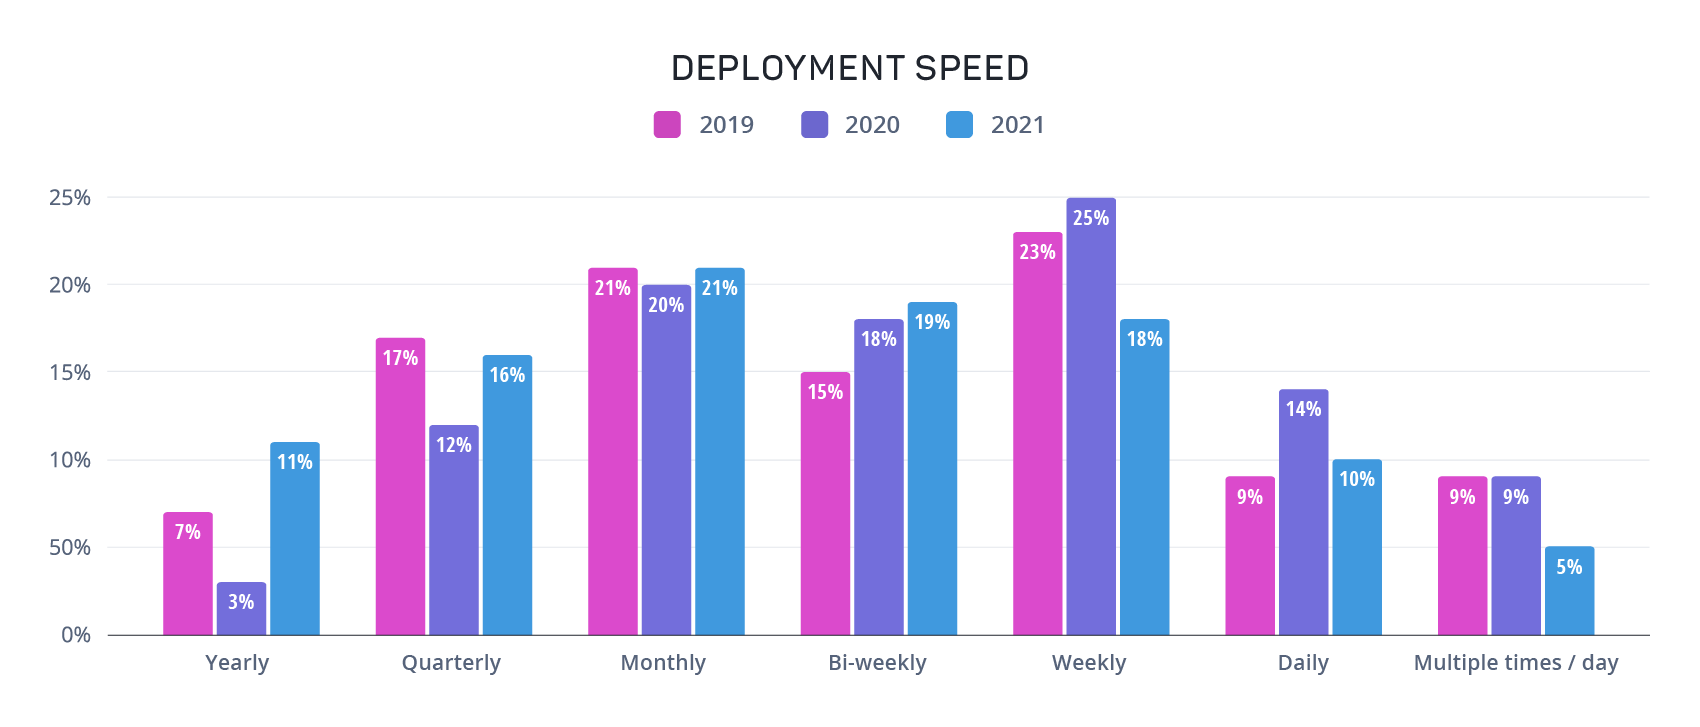
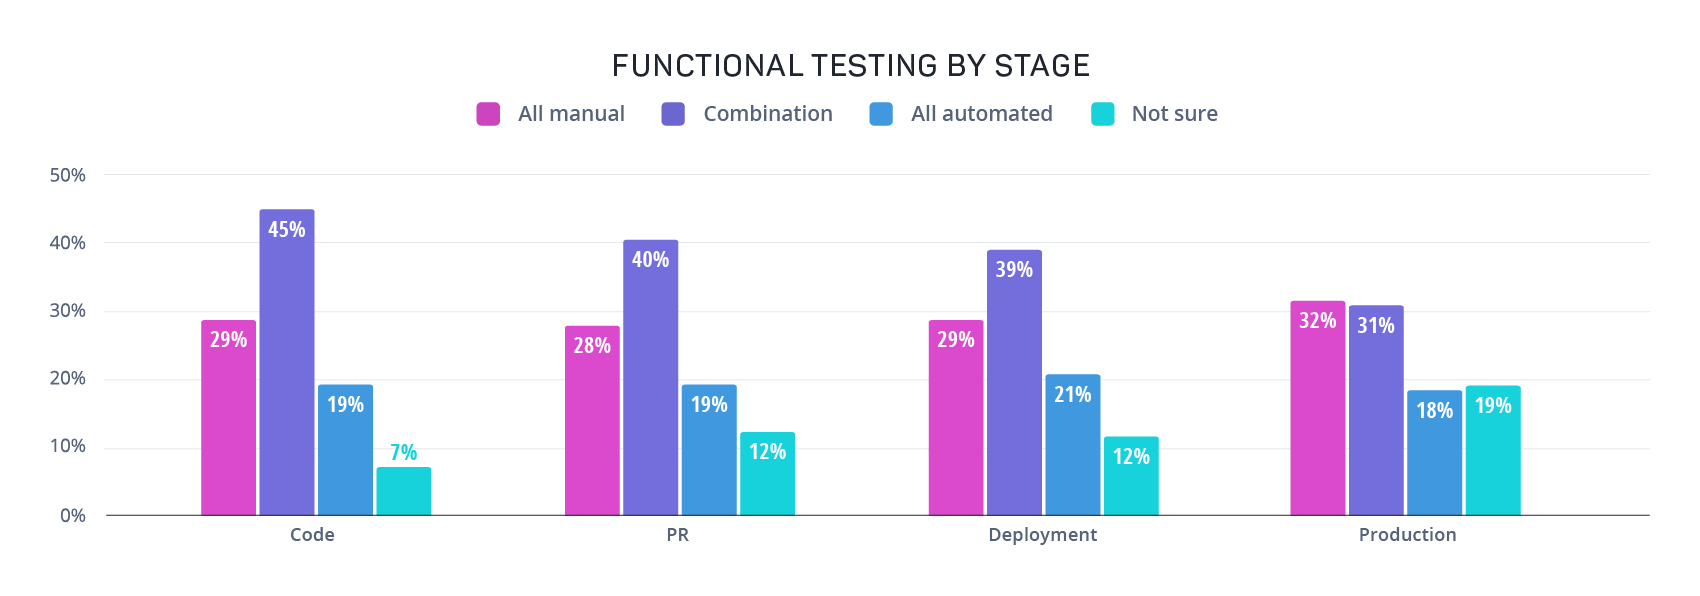
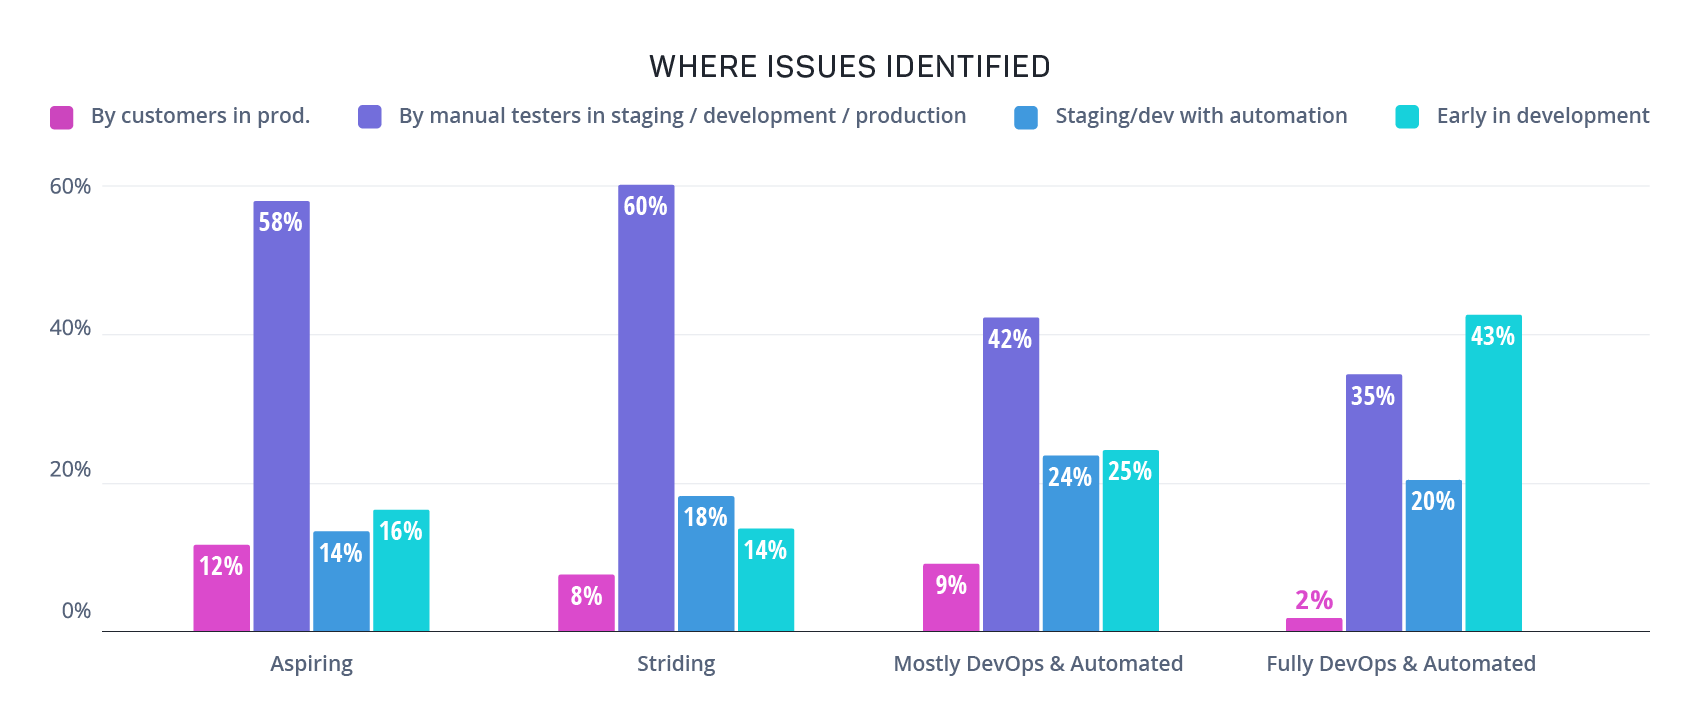
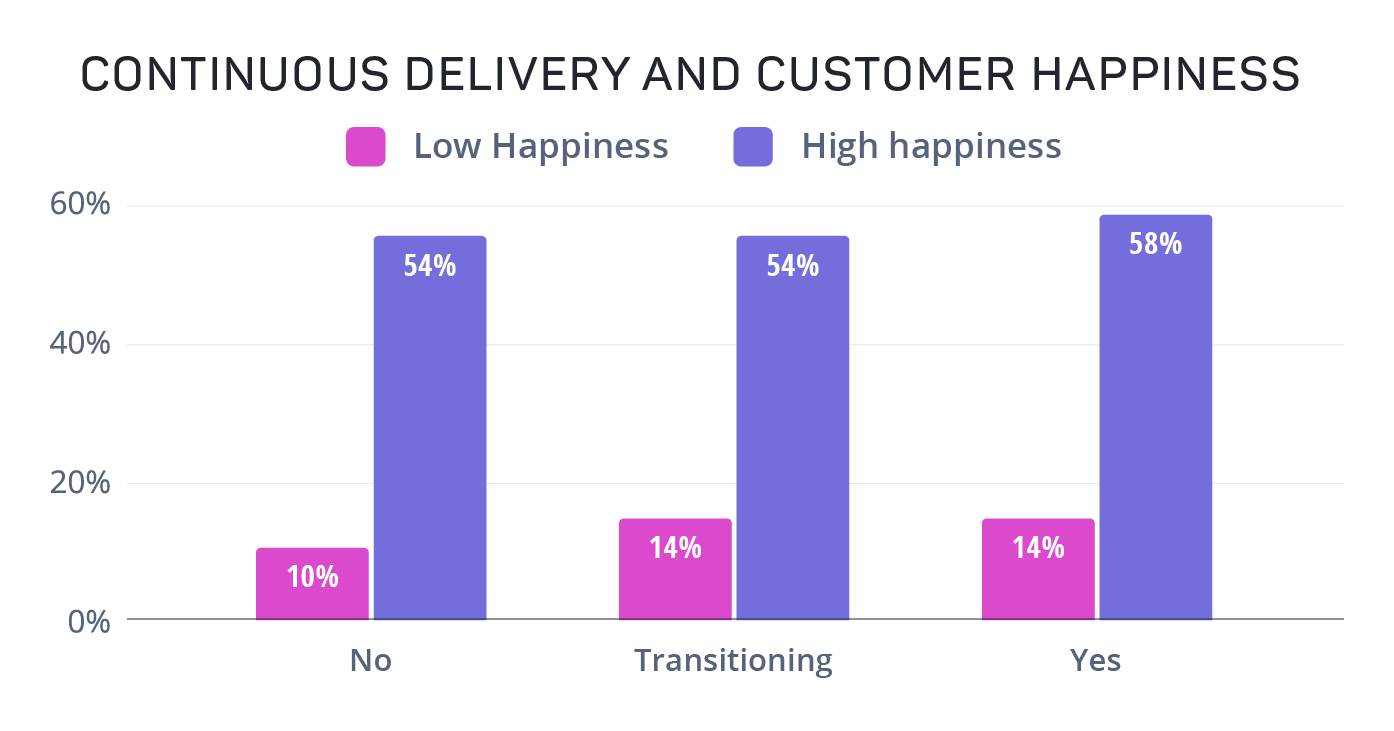
Though accelerated product velocity is the most commonly cited benefit of DevOps adoption, our research showed the speed of development remained relatively flat in 2020-2021. Though a third of teams are now deploying new code at least once per week, almost half still deploy less than once per month. The number of teams that deploy new code daily or multiple times a day (15%) is roughly equivalent to those deploying on a quarterly basis (16%).

Graph
Graph

When broken down by stage of DevOps adoption, the divide between weekly or daily deployments and monthly or quarterly deployments becomes clearer. The majority of teams deploying new code on a weekly or daily basis are running a full DevOps practice, with the bulk of biweekly and monthly teams in the process of DevOps adoption. Aspiring DevOps teams are the most likely to be on a quarterly or annual deployment schedule.

Despite the flat trend in speed of development, enthusiasm for DevOps and CI/CD adoption remained strong. As we saw in the previous section, interest in CI/CD adoption actually grew considerably over the course of the past year, leading to an uptick in teams transitioning to more fully automated pipelines. With more teams maturing their DevOps practice, the benefits are expanding beyond pure sprint speed.

Graph

Automation is the Key to a Culture of Quality

To better understand how automation impacts quality, we asked a series of questions around where and how teams are automating tests.

The data revealed that most teams are focused on core testing - the most popular types of tests being automated are UI/Functional, unit, and regression tests - and fewer have implemented non-functional tests like performance and visual.

graph-types-of-automated-tests-07JUL2021

Additionally, we discovered that test automation aligns with DevOps maturity. Teams that have implemented mostly or fully automated pipelines are automating more types of tests. For teams just getting started, they have narrowed their focus to automating core tests.


After those core tests are automated, more mature organizations are more likely to move on to more complex scenarios that include automating integration, end-to-end, and performance tests.

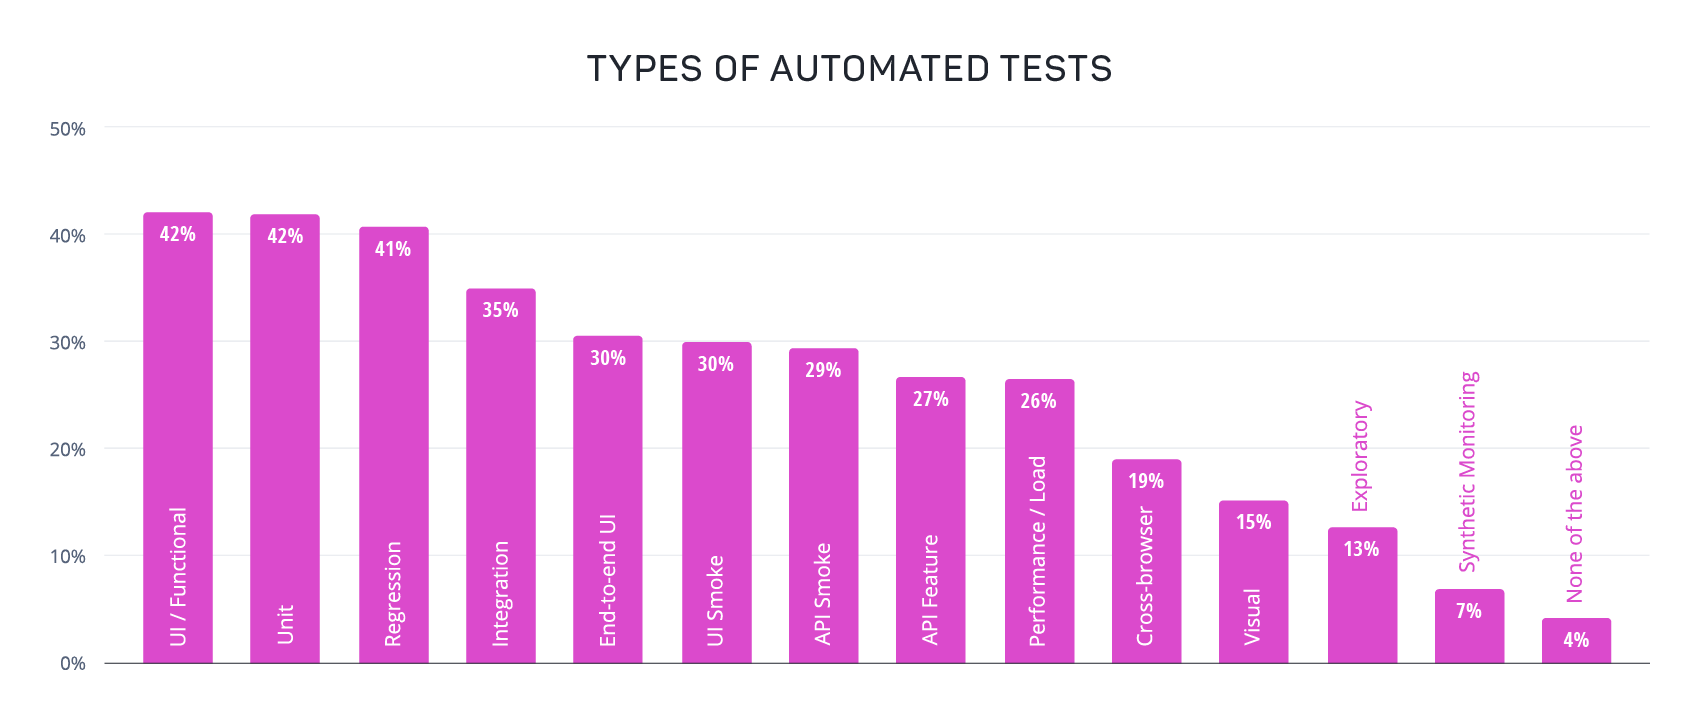
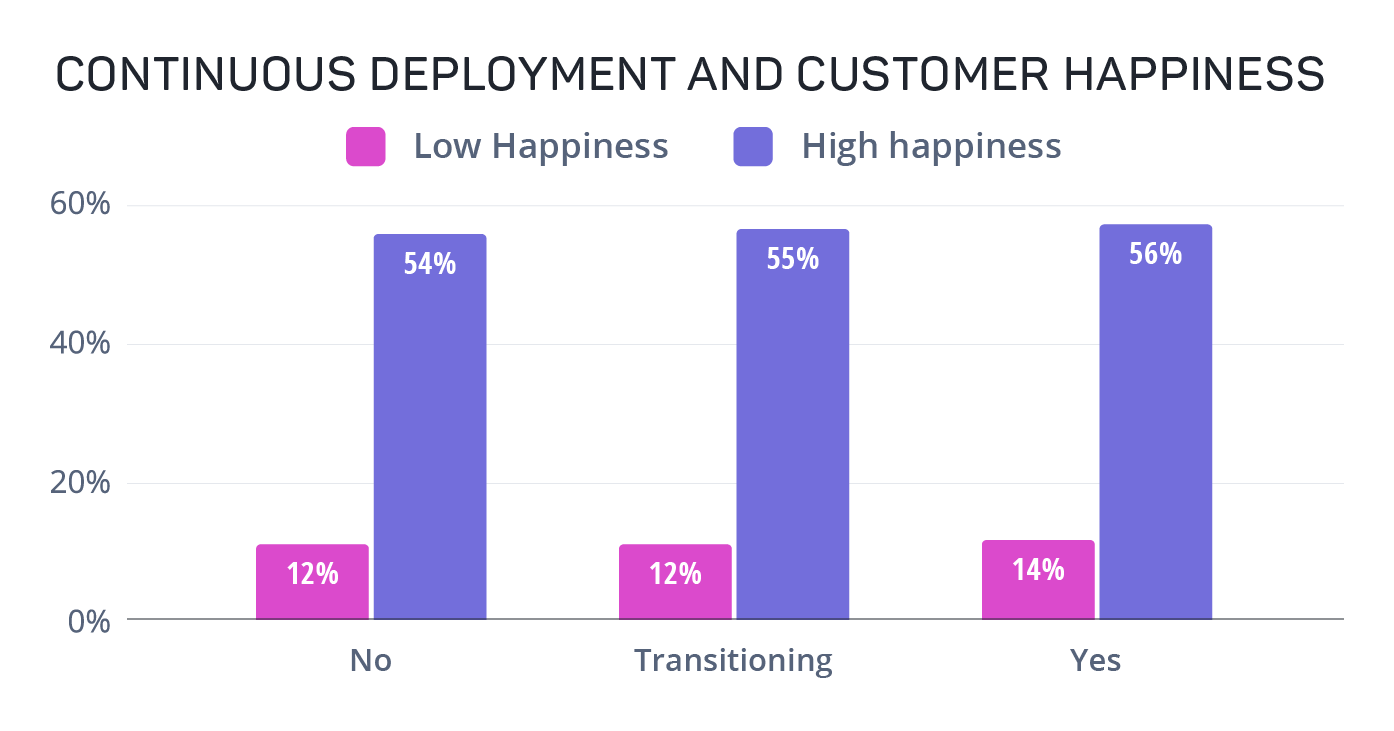
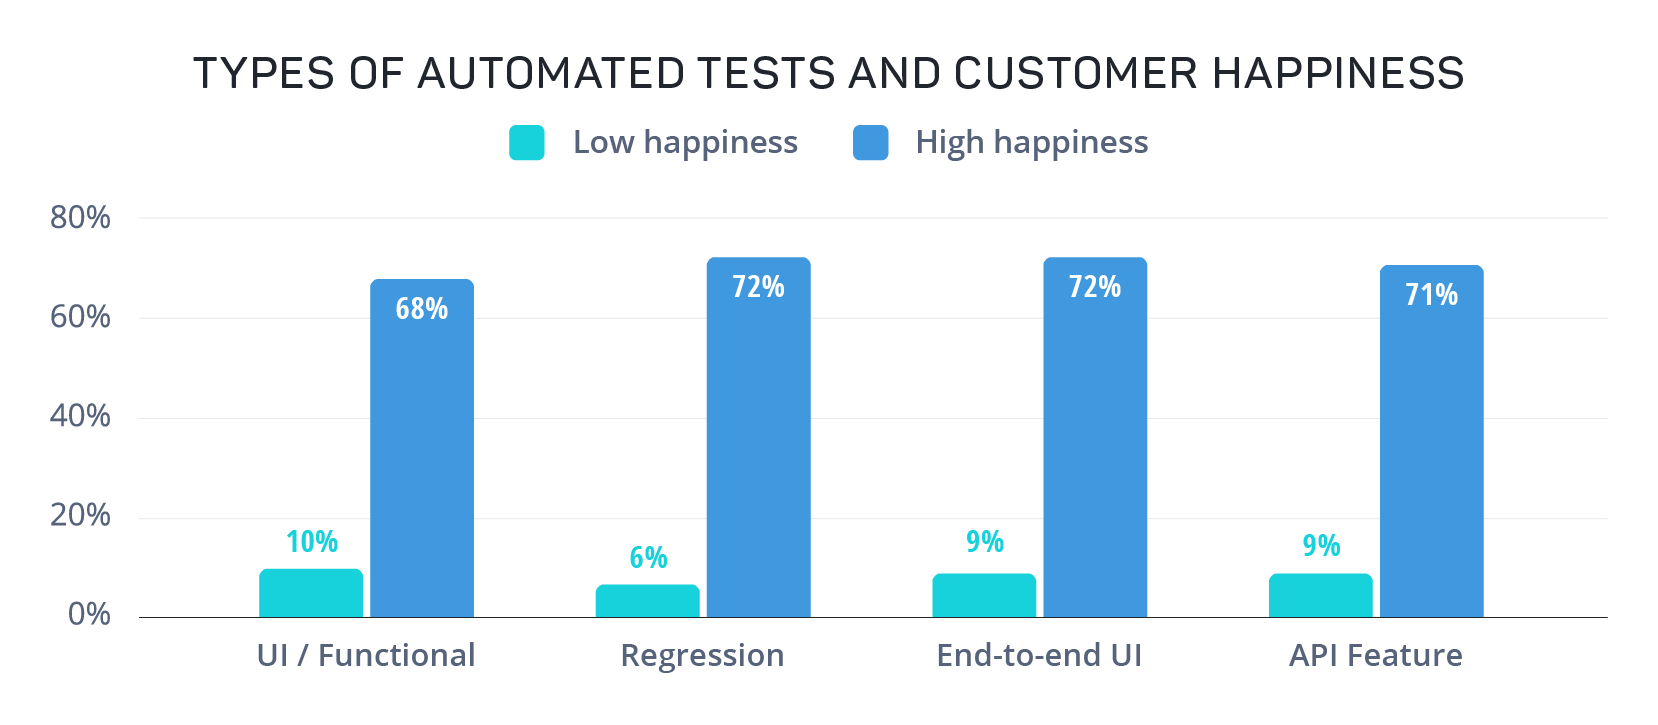
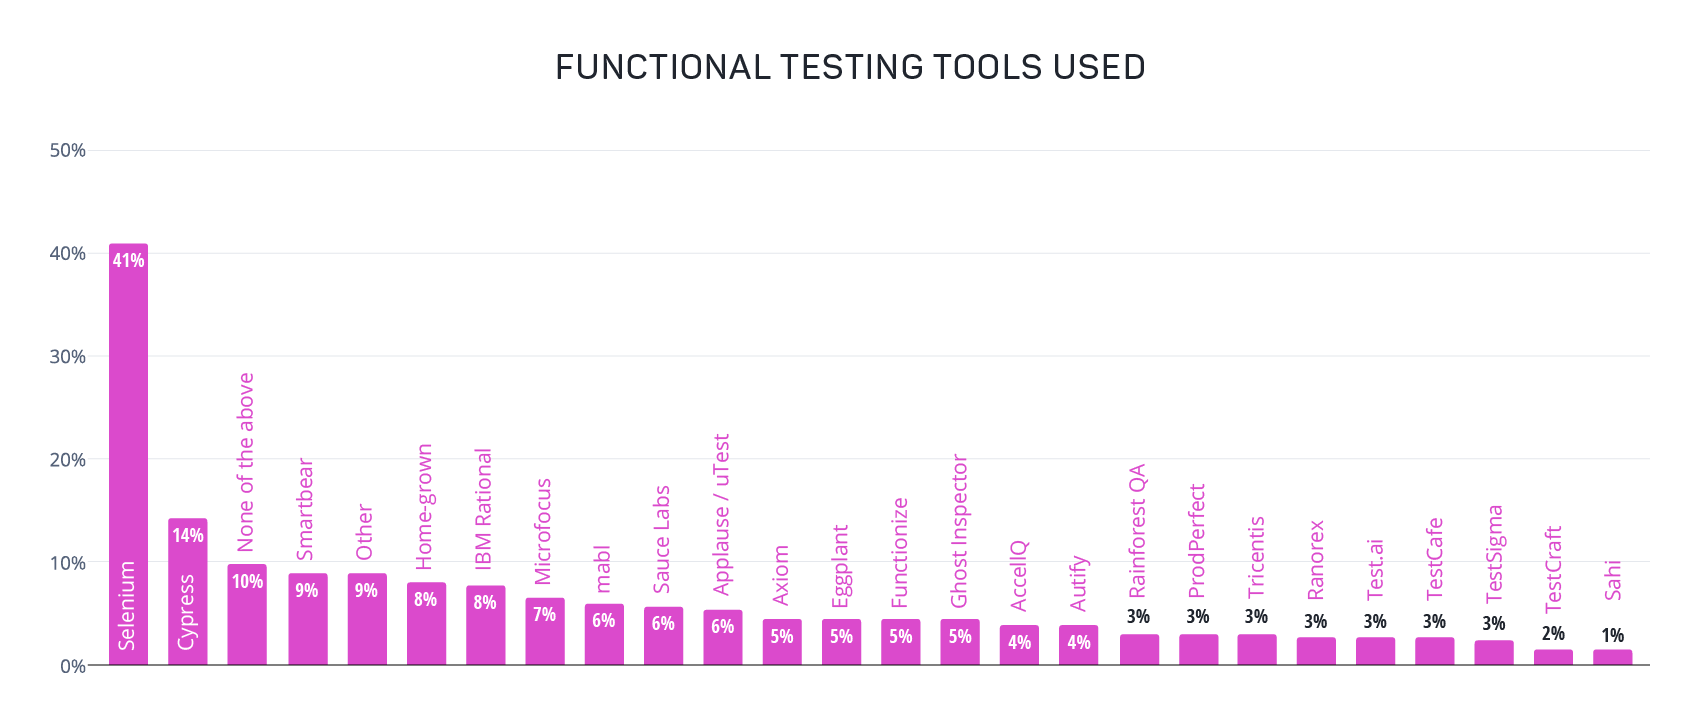
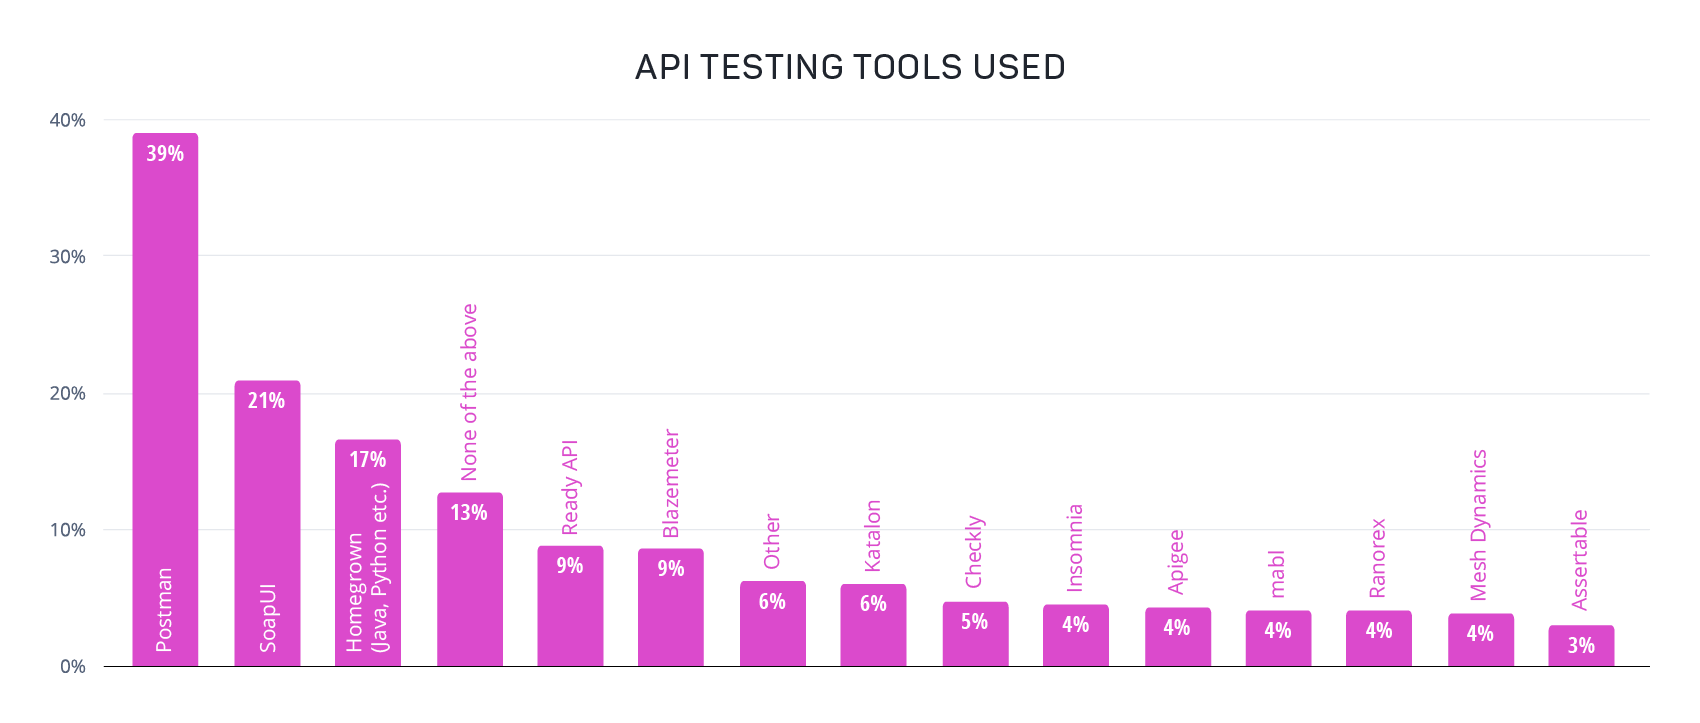
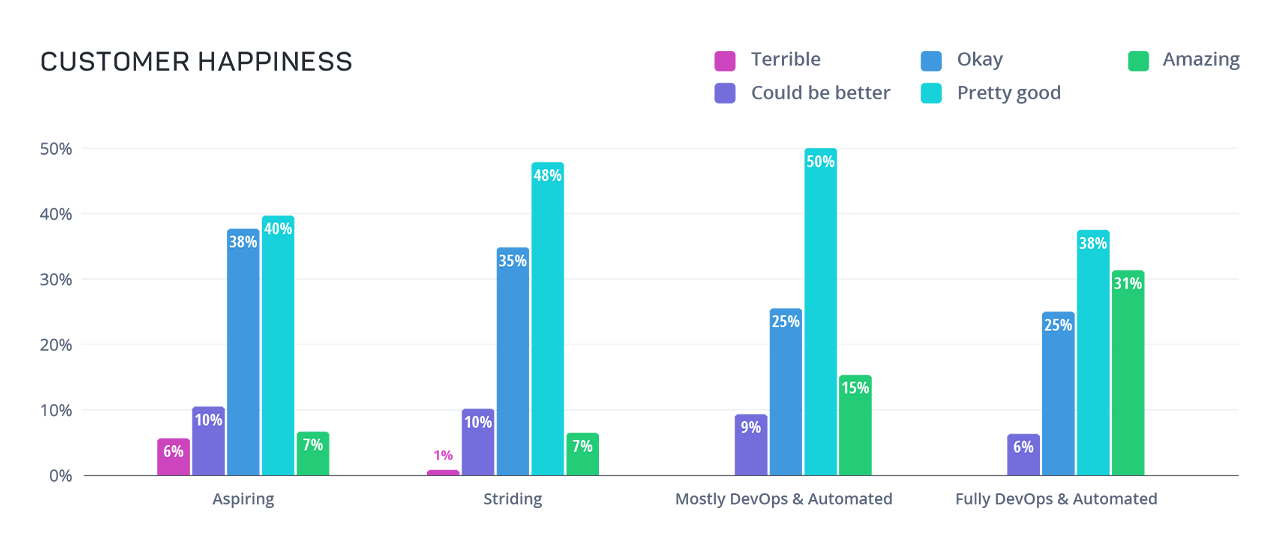
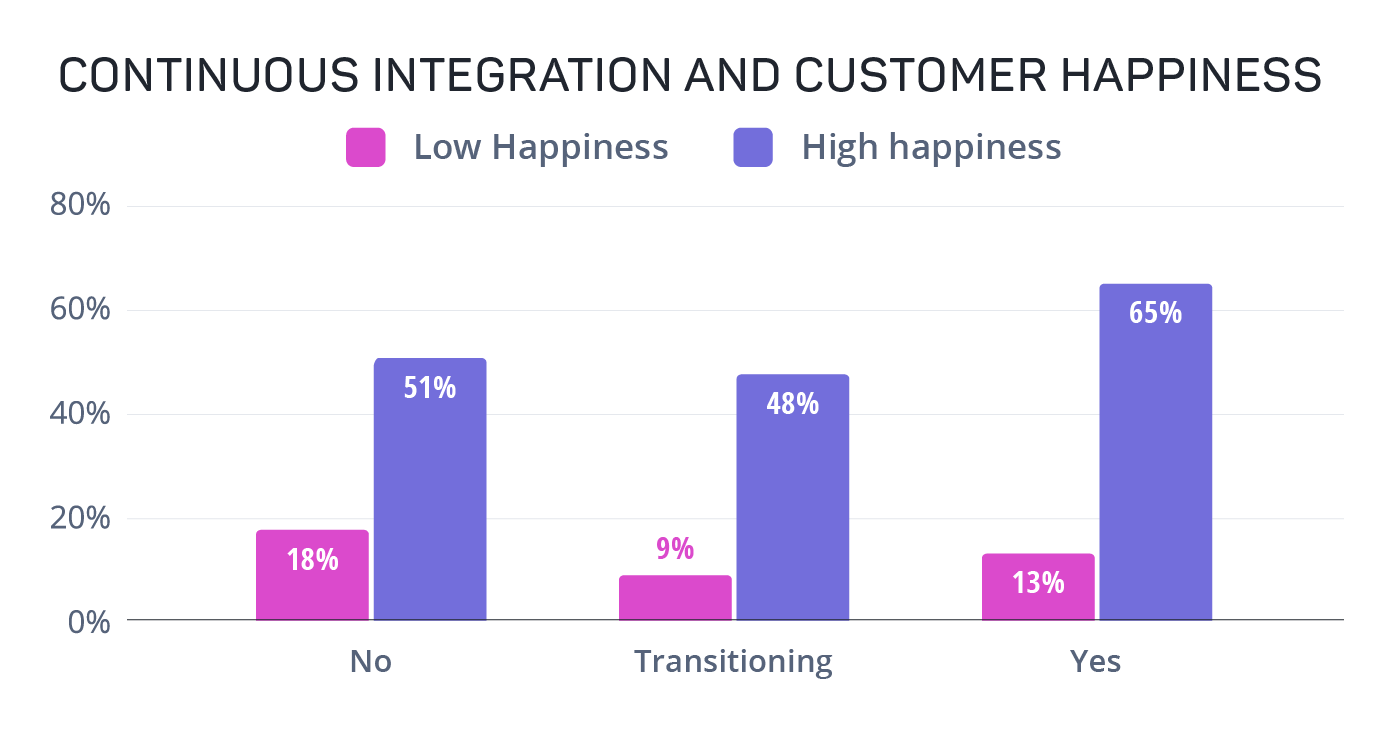
The data also revealed that when teams are automating core tests like UI/Functional, regression, end-to-end UI, and API tests, there’s a significantly higher likelihood that customer happiness is high as well. They indicated their customer happiness is pretty good or amazing, whereas teams not automating these types of tests rated their customer happiness as could be better or terrible.


graph-automated-test-types-and-customer-happiness-07JUL2021

One very interesting revelation from this year’s data is that most teams - regardless of where they are in DevOps maturity - rely on a combined automated and manual testing approach.

And despite automation having a distinct presence in DevOps, there is still a significant number of teams that are doing all manual testing.

graph-functional-testing-by-phase-07JUL2021

Limits on automated testing continue to be a major obstacle to creating a culture of quality, where testing is a collaborative, integrated part of the software development lifecycle. Since most organizations rely at least in part on manual testing, the bulk of testing is still confined to the deployment and production stages.

The main exception: mostly or fully DevOps teams. More than half of the teams with full DevOps have built a culture of quality into their development pipeline.

Testing Distribution by Phase

Graph
Graph
Graph
Graph

The stark differences between DevOps teams and those still on their journey to DevOps shows how critical automation is to building a culture of quality. Therefore, interest in test automation showed an uptick this year, as well as some migration away from one of the most established test automation tools, Selenium.

41% of respondents said they used Selenium in 2021, compared to 43% in 2020. The number of teams using no test automation solution also shrunk from 13% to 10% compared to the previous year.

graph-functional-testing-tools-07JUL2021

One last point worth noting is that functional test automation is incomplete without integrating API testing to validate the full end-to-end user experience. Although only about a third of respondents indicated they were automating API tests, the majority of them are using Postman, followed by a variety of other solutions.

As teams mature in DevOps and build a culture of quality, we project that API testing will grow in relevance and adoption.

Graph

Quality Differentiates DevOps Teams

The hidden advantage of DevOps: better software quality. We asked our respondents how their organizations viewed the role of QA, handled cross-functional collaboration to triage bugs, and how their customers feel about their product to understand how quality engineering contributes to more effective software development teams and overall business success. The first thing we found was that most organizations not running full DevOps are still defining their relationship with QA.

Almost 20% of DevOps aspirants said QA was a necessary evil, while most teams making strides towards DevOps or mostly DevOps teams say that they only do some testing right before code is released. In stark contrast, over 50% of fully DevOps teams said that they have a culture of quality, testing early and often throughout development.

Graph

Given those numbers, it’s no surprise that most survey respondents described their test coverage as “good enough.” Fully DevOps teams were the only group to favor more positive views, with 36% saying their test coverage was “really good” and 23% saying it was “excellent.”

Graph

This trend carries through to the end user, your customer. A large majority of teams that are full DevOps have shared that their customers would rate their application as either “amazing” or “pretty good.” Fully DevOps teams were by far the most likely to say their customers love their product, with one-third falling in the “amazing” category. 

DevOps aspirants, on the other hand, only described their customer happiness as amazing 7% of the time. Though most teams are managing product quality without full DevOps, it’s clear that DevOps adoption is key to getting ahead of product issues and building long-term customer happiness.

Graph

The Changing Role of QA

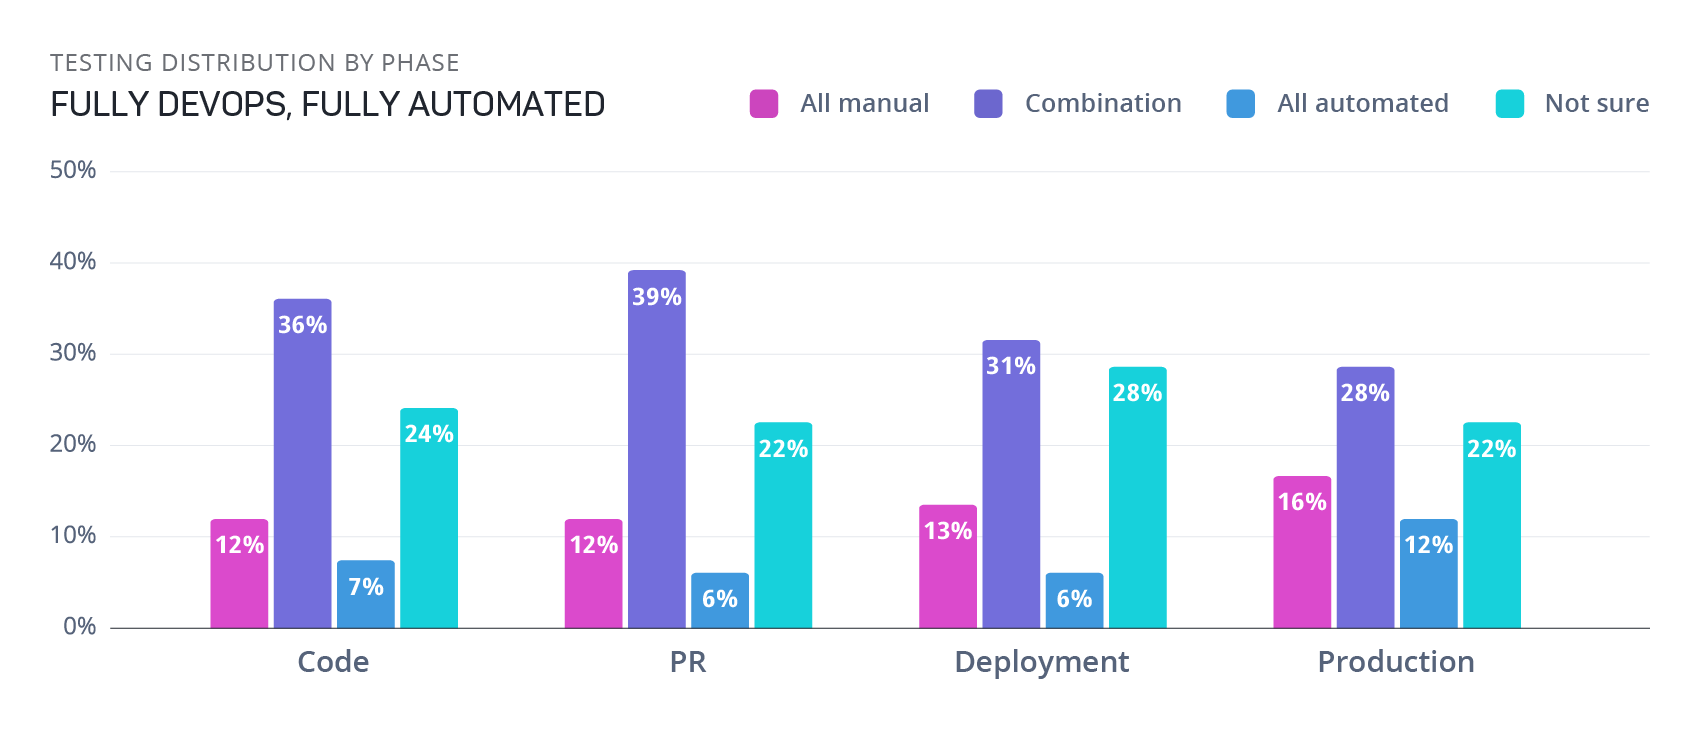
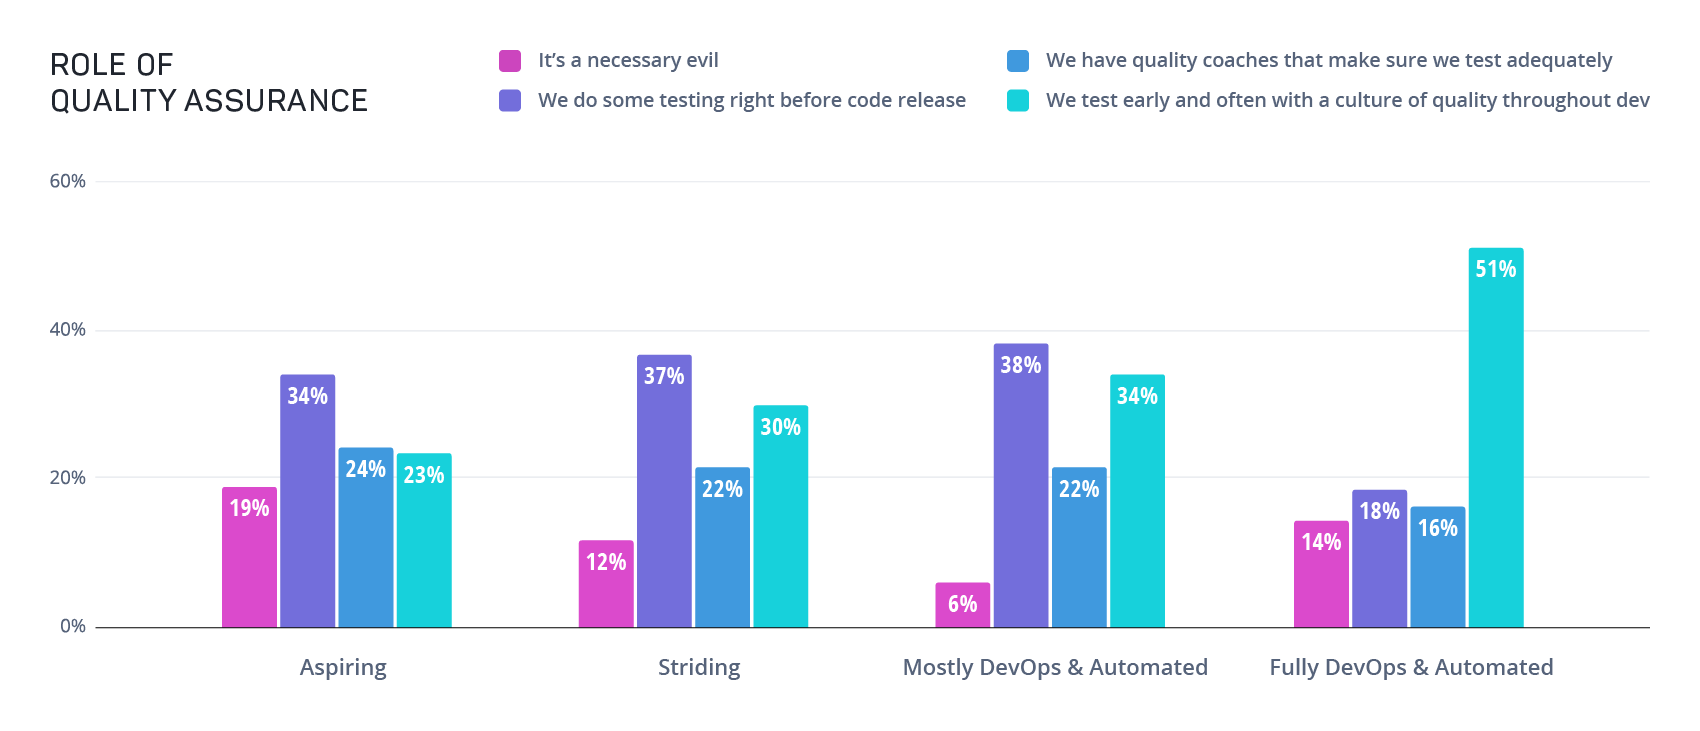
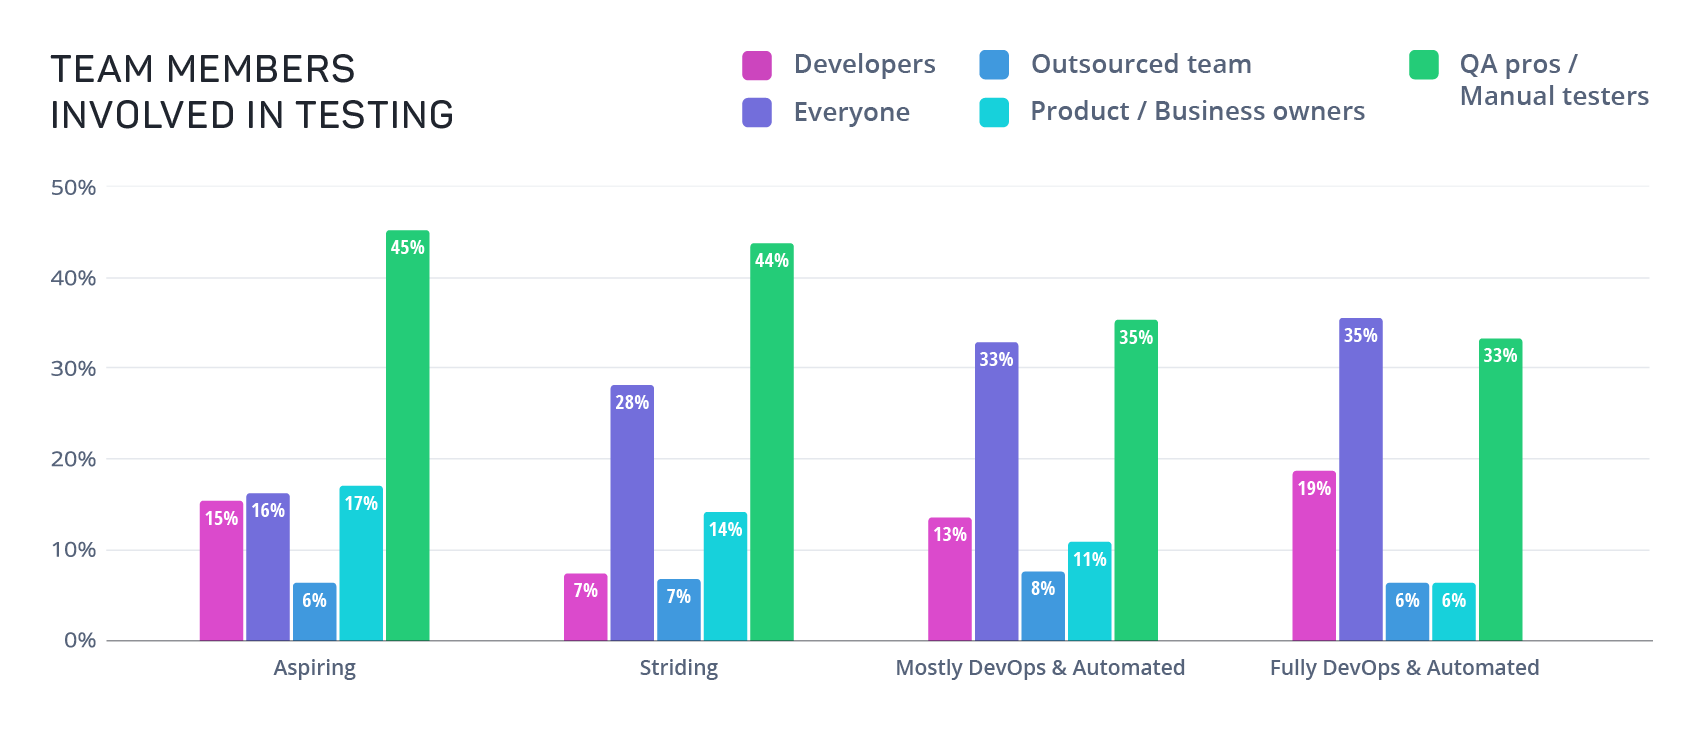
So what does a culture of quality look like for leaders in DevOps? Naturally, QA professionals hold a leadership role in quality, but DevOps teams share responsibility across the entire team, especially as DevOps matures in the enterprise.

graph-team-members-involved-07JUL2021

As teams move from manual to fully automated pipelines, the data shows they get better at applying testing best practices and catching bugs earlier in production. When bugs are caught earlier, teams save time and effort addressing them, making it easier to deliver quality software quickly - which also improves customer satisfaction.

graph-where-issues-found-07JUL2021

Not only do DevOps teams that have embraced automated pipelines identify bugs earlier in the development process, they’re able to address them much faster. 62% of DevOps teams are able to fix bugs within eight hours, while even mostly DevOps teams need 8-24 hours to address defects.

For a fifth of aspiring DevOps teams, bug fixes take two days to repair, a serious delay if deployments happen on a daily, weekly, or bi-weekly basis.

graph-engineering-handoff-07JUL2021

A key component of addressing bugs quickly with minimal disruption to deployment schedules is how easily testers are able to hand issues over to engineering. With DevOps, the entire pipeline is integrated, making it much easier to collaborate across QA and development. Almost half of DevOps aspirants admit that the handoff process needs improvement, as do 46% of those making strides towards DevOps. Once an organization is mostly DevOps, however, the tide turns. With more automated pipelines the handoff from QA to engineering gets better and approaches seamlessness.

The data shows that 63% of fully automated teams describe that handoff as pretty good or seamless, while 56% of mostly DevOps teams are happy with their ability to collaborate between quality and engineering teams. Additionally, what the data also reveals is that the handoff between teams is directly correlated with test coverage. Teams who have really good or excellent test coverage also have a good and/or seamless handoff of issues between teams. The data shows more obviously that when test coverage is inadequate there’s a high likelihood that the handoff to engineering needs improvement or, even worse, is downright painful.

Graph

Taking it one step further, the data showed that for teams who have good to excellent test coverage, they are more likely to resolve bugs faster. 63% of teams who are resolving issues in less than 8 hours said their test coverage is excellent.

Both of these charts demonstrate additional examples of how test coverage is emerging again as a key success criteria for software teams.

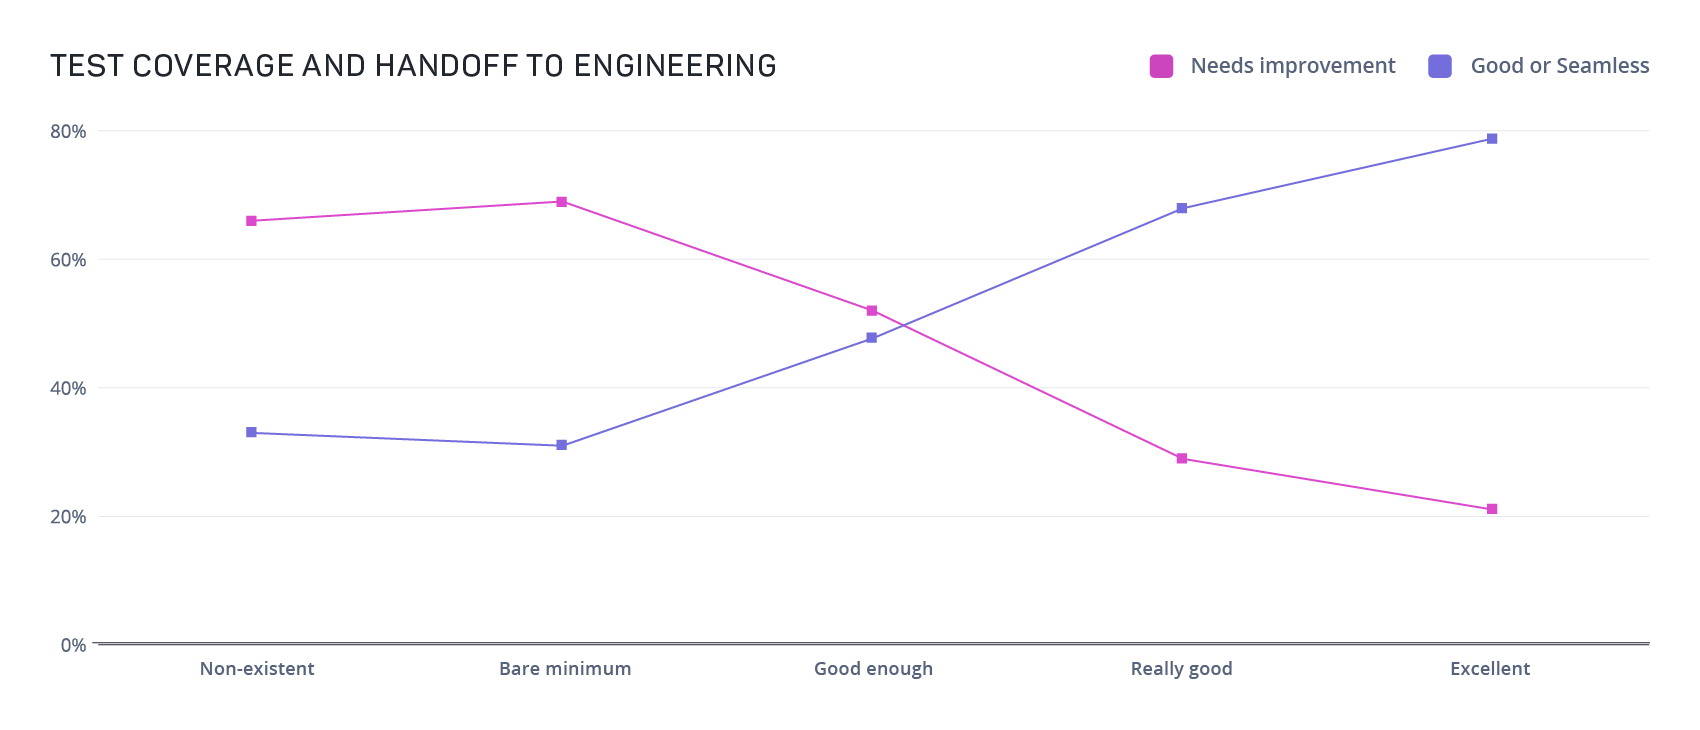
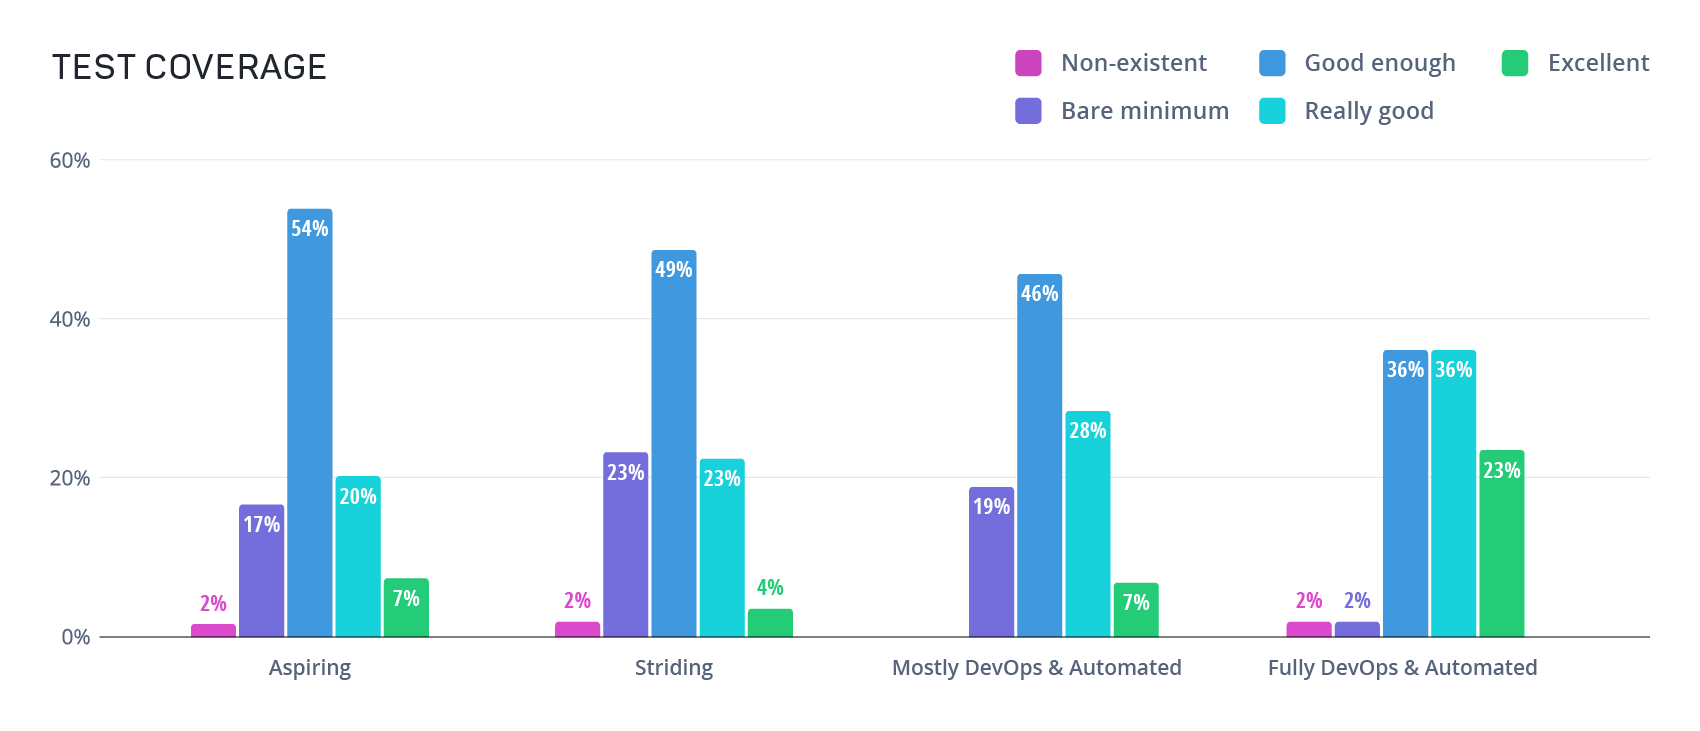
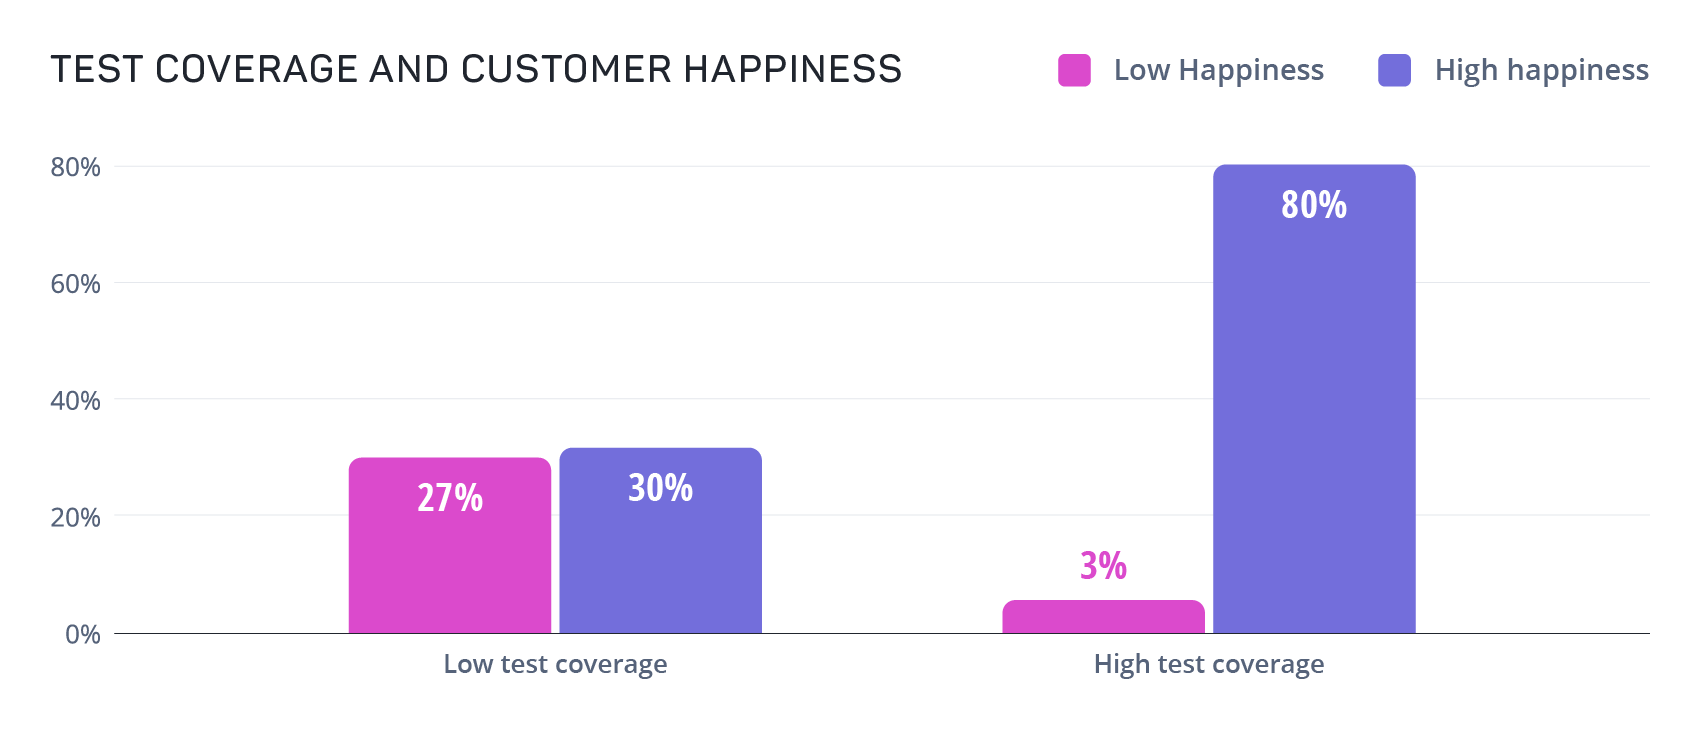
Furthermore for teams who have greater test coverage (really good or excellent), customer happiness is also impacted. 80% of teams who reported high test coverage also reported high customer happiness (pretty good or amazing).

Graph

Test coverage has a significantly higher impact on customer happiness when compared to continuous integration, continuous delivery and/or continuous deployment adoption. While the net gain for high test coverage is a stark 50%, the return for teams who have fully transitioned to CI/CD only earns a net gain of 14% for continuous integration, 4% for continuous delivery, and 2% for continuous deployment.

The data makes a strong argument that supports investing in ample test coverage to ensure customer happiness, which is more favorable than deeper investments in CI/CD.

Graph
Graph

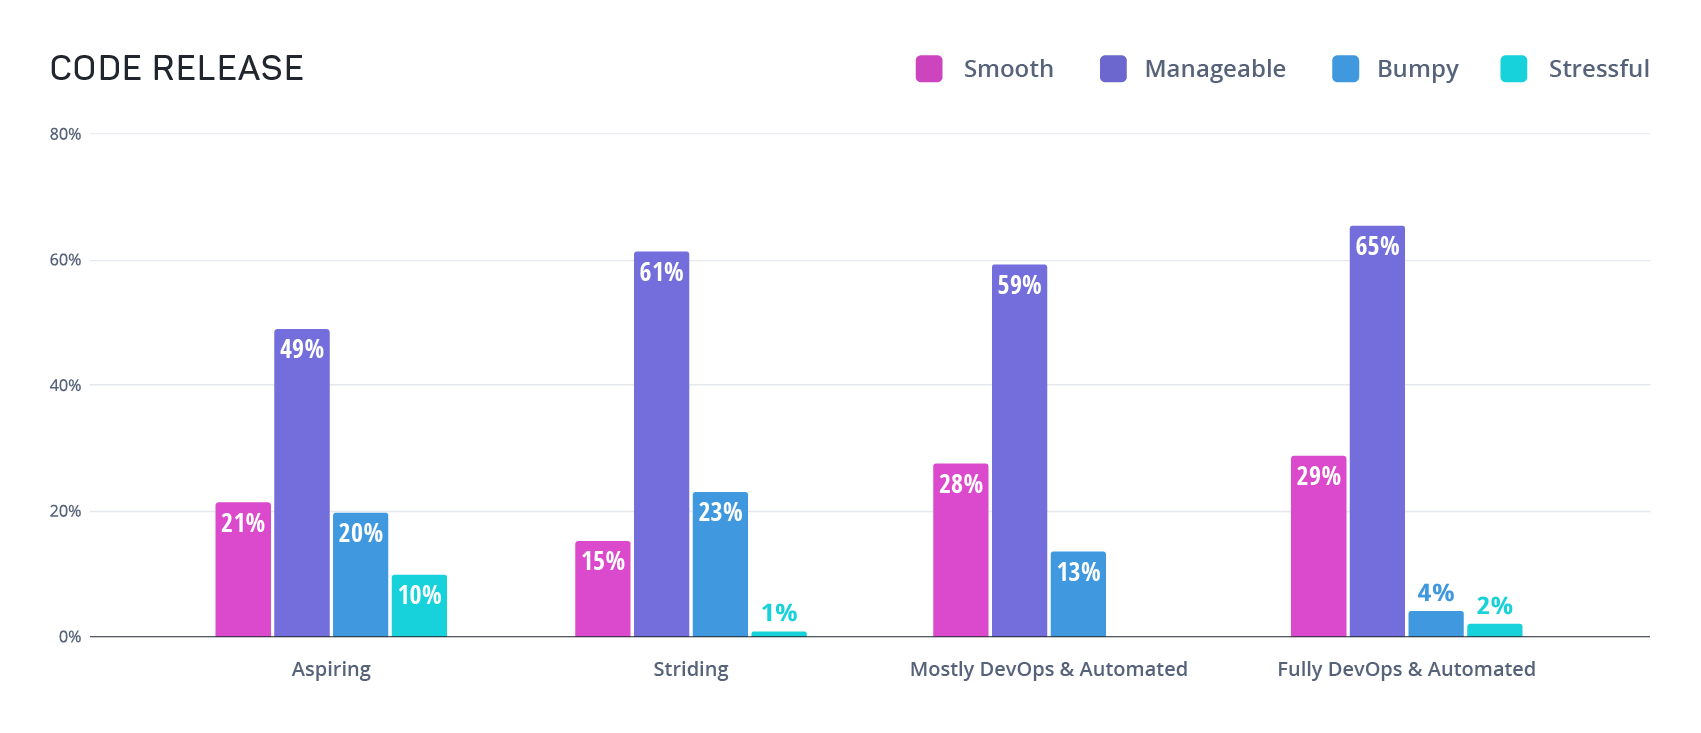
With DevOps, a collaborative culture enabled by automation builds a pipeline and a process that teams have confidence in. When asked about their stress levels on release days, most DevOps teams say the process is manageable with little stress.

Almost one-third of DevOps teams even describe release days as smooth with no stress at all (must be nice, right?).

graph-continuous-deployment-and-customer-happiness-07JUL2021
Graph

Though the organizations on their DevOps journey - either making strides towards full adoption or mostly DevOps - are also most likely to describe their release days as manageable, the risk for bumpy, stressful releases is much higher.

Compared to the 2% of stressed out full DevOps teams, 12% of mostly DevOps teams say releases are challenging and 27% describe their releases as highly stressful. Low-stress release days also result in teams that are more confident in their releases:

Graph

Teams with more automation feel more confident in their releases; while teams that have manual pipelines are much less confident. One thing to note though - the majority of respondents feel that they could have tested more, even if their team is fully DevOps.

A culture of quality creates a positive feedback loop within a DevOps pipeline, improving team confidence and collaboration while ensuring that testing is thorough and customers receive a flawless product.

Key Takeaways

Overall, most software delivery teams managed to continue their DevOps journey throughout the pandemic, even accelerating adoption of processes like CI/CD. But quality remains both a key opportunity and a key challenge, with DevOps more likely to successfully adopt test automation and build a culture of quality.

Improvements in DevOps tools has democratized DevOps adoption

  • No single category of business (large enterprise, medium enterprise, small and midsize businesses) owns DevOps adoption
  • The biggest inhibitors to DevOps are the slow process of change and budgetary challenges

The pandemic accelerated the transition to CI/CD/CD

  • Most teams (60%) have adopted CI and another 33% is transitioning, an increase of 10% compared to 2020.
  • A plurality of respondents said they’re in transition to Continuous Delivery (38%), while nearly the same percentage have already adopted it.
  • 27% of teams have adopted Continuous Deployment. Another 36% are in the transitioning process, and a full 25% of respondents say they have no plans to implement CD at all.

Teams maintained product velocity despite the pandemic

  • Though a third of teams are now deploying new code at least once per week, almost half still deploy less than once per month. The number of teams that deploy new code multiple times per day (15%) is roughly equivalent to those deploying on a quarterly basis (16%).

Manual and automated testing coexist in all teams

  • Most teams - regardless of DevOps adoption - are using a combination of manual and automated testing to manage quality.
  • Test automation is mostly used for functional testing, with UI and unit testing serving as the most common types of automated tests.
  • More teams adopted test automation during the pandemic, with just 10% using no test automation tools at all.

Take Your Testing to the Next Level

Start your free mabl trial today! It’s the only SaaS solution that integrates automated end-to-end testing into the entire development lifecycle.