
Much like a good designer, a good tester spends a lot of time anticipating how users might interact with an application and validating all those paths work. According to Angie Jones, “Testers discover the unknown, and this skill is still very much so needed, whether there’s automation or not”. This process is often called exploratory testing and can be invaluable in identifying issues with a product before customers do.
But once features hit production, much of the previously unknown becomes known. We have a better source of data on how users use our app - the actual customers! As an industry, we’ve largely integrated user data into the other aspects of the software development process. Usage analytics tools such as Mixpanel, Amplitude, and Localytics have been around for years.
|
More recently, tools such as FullStory have given developers and user experience designers the tools to uncover even more detailed data about how users consume their application. Optimizely and other A/B testing solutions have gained popularity, allowing easy experimentation and rapid response to user feedback. Despite this, the application of real user data to testing efforts is still very much in its infancy. For the most part, teams using user data to inform testing efforts are doing so in a bespoke manner. |
|
Coverage Metrics
Fundamentally, coverage is a simple equation. Take the number of “foos” that are tested and divide by the total number of “foos”. The challenge is in choosing what to measure. Typically, no single measure provides a full picture of testing coverage, so teams will choose a handful of metrics to track. In unit tests, where coverage metrics are most heavily used, it is common to measure classes, lines, conditional branches, and a number of other dimensions. Each metric tells you something different about your test coverage. For example, conditional coverage can help you find potentially under-tested code paths.
For end-to-end web testing, coming up with a reasonable set of measures can be challenging. Code metrics are fairly well defined but tend to be less than informative in end-to-end (E2E) testing. Things like “pages”, “components”, and “user flows” are more useful but also more difficult to measure. What constitutes a “page” in a modern web application? How many distinct “user flows” does your application have?
Introducing mabl Coverage with Real User Data
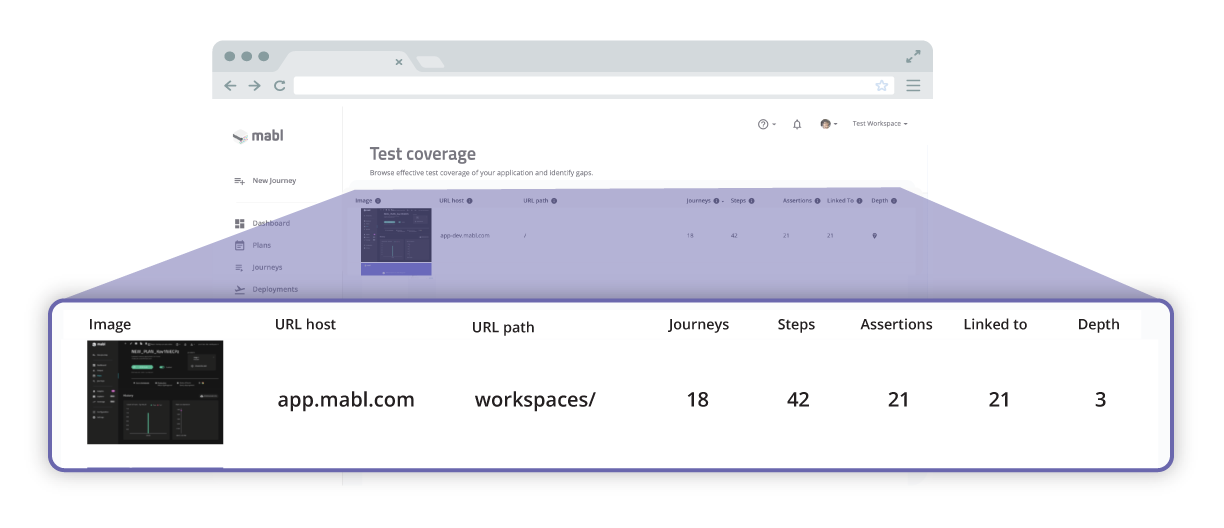
So if it’s difficult to measure meaningful coverage for E2E (end-to-end) tests, how does mabl go about it? For starters, mabl was built from the ground up with the principal of observability baked into our testing infrastructure. An average mabl test emits over 250 distinct observation events per run and collects a wide array of data in the process including DOM snapshots, screenshots, network traffic, and detailed information about page interactions. This makes it fairly easy to measure the number of things covered by a test in a number of ways, including pages tested, unique elements interacted with, and unique elements asserted against.
“Test coverage is a useful tool for finding untested parts of a codebase. Test coverage is of little use as a numeric statement of how good your tests are.” - Martin Fowler
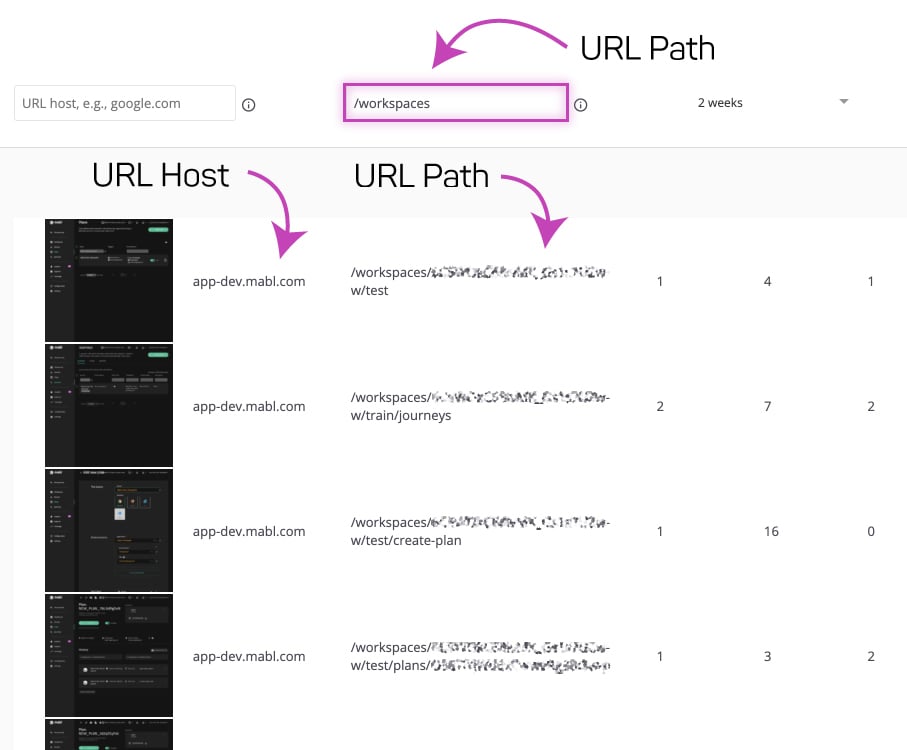
Measuring the total number of things we might wish to test, is less straightforward. Without any external data, we start by leveraging mabl’s built-in link crawler to discover previously untested pages automatically. In this way, we can discover pages to potentially test but all pages are not of equal importance. As a means to rank the pages mabl discovers, mabl can analyze the DOM to compute page complexity and discover how far the page is from the root along with how many other pages link into it.
For unit testing coverage, metrics like the above that let us measure page importance in a vacuum might be enough. But the goals of E2E testing are different from those of unit testing. The main reason we do E2E regression tests is to ensure that the user experience is working. We want to identify the untested flows that have the highest business impact. For this, a measure that incorporates what users are actually doing makes more sense than something more naive that just looks at raw number of pages.
Integrating with Segment provides that data and allows us to report coverage based on user behavior instead of just raw pages/views.

Not just another integration
While we are big believers in DevTestOps, the reality is that many of our customers are still part of siloed QA teams with limited to ask development teams to integrate new tools into their application. Even for our customers further along the DevTestOps journey, modern web applications are already heavily instrumented with many dependencies. Performance is a major concern for everyone.
This is what made Segment such a perfect fit for our first integration of real user data. Existing Segment customers can turn on the mabl integration with a couple of clicks and get real user-based test coverage with zero development effort or impact on their existing customers. For customers already on Segment, it’s an easy win, and for other teams struggling with a plethora of one-off integrations, I encourage you to check it out.
Understanding your application through testing
One of the major benefits of tying together tests with real usage data is that it allows us to combine the knowledge of what’s important to testers with what users are doing. While observed user behavior teaches us what paths users take through an application, testing data serves as documentation of the product meaning of those flows.
As the first step down this path, mabl is beginning to expose a page-based model (see below) of the application under test. This model enables mabl to make sense of application health at a step above individual test results. Look for it to be exposed directly and indirectly throughout mabl in the coming weeks. Pairing this model with user actions helps to make it more reliable, and early investigations into using the two in conjunction to derive coverage, based on core user flows, shows promise.
Look for many new exciting features making use of this data in the days to come!


