There are a core set of questions any developer or tester asks when evaluating a new tool. What does it do? How does it help save me time or improve the quality of my product? And assuming the answer to those questions is of interest, How do I integrate it into my workflow?
As we continue to increase our engineering investment in this area, we thought it might be useful to share how we are integrating mabl into our development workflow. Dogfooding, if you will.

Setting up the tests
First, a note on environments. The standard, recommended setup for mabl (and how you would be using mabl) would be to create a set of journeys and then create a plan for each environment you want to run those journeys in.
In our case, we want to be prudent; if we have a major issue in mabl’s production environment, we run the risk that mabl won’t be healthy enough to tell us about it. For that reason, we point our staging environment at mabl production and our production environment at mabl staging.
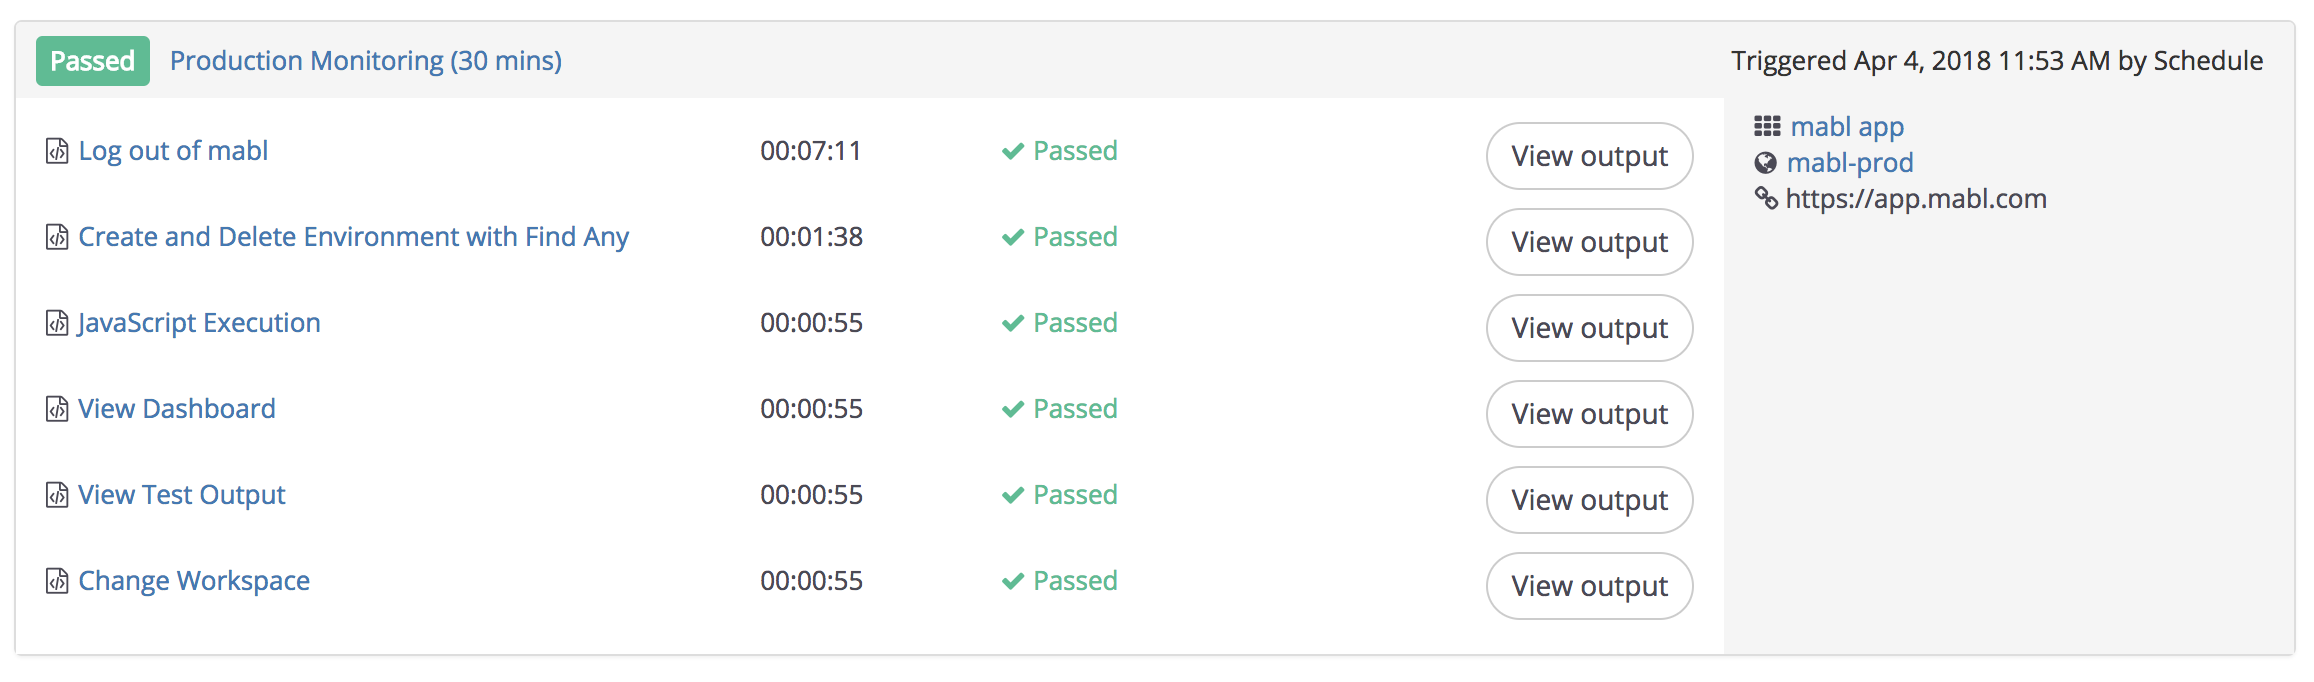
Now we need to setup the actual tests. First, we created a set of core mabl smoke tests. This contains the things that if they break for any reason, we want someone to look at it immediately. We put those in a plan that runs every 30 minutes.
Then, we added more targeted regression testing that runs less frequently, a few times a day. We group the broader set of regression tests by major feature category as opposed to placing them all in a single plan.
From there, we rely on the development team to add new mabl tests as part of our regular development process. Whenever we deploy code, we have a deployment checklist of things the engineer triggering the deployment needs to check, and if the deployment completes a major feature, one of those items on the deployment checklist is to add any new mabl tests needed. Whether these tests need to be added to the smoke test plan is left to individual discretion.
Triggering tests
It’s all well and good to have our tests up and running on a regular schedule but most of our engineers, myself included, are impatient. I don’t want to wait 4 hours to find out if the code I just deployed caused a regression; I’d like to know as soon as possible. Luckily, we can get more immediate results by integrating our regression tests with mabl’s deployment API. To do this we need to configure our CI/CD build system to call the mabl deployments API after doing a deployment. We currently configure all of our tests to have a deployment trigger, so this will run our full set of mabl regression tests.
Who do I wake up?
We’ve got our tests triggering on a regular schedule and all our deployment events. To complete the cycle we need to be able to act on the results of the tests.
To achieve this, we maintain #ops-alerts and #ops-dev-alerts channels in slack. We integrate all our tools that send us alerts about our environments to these channels, including mabl:
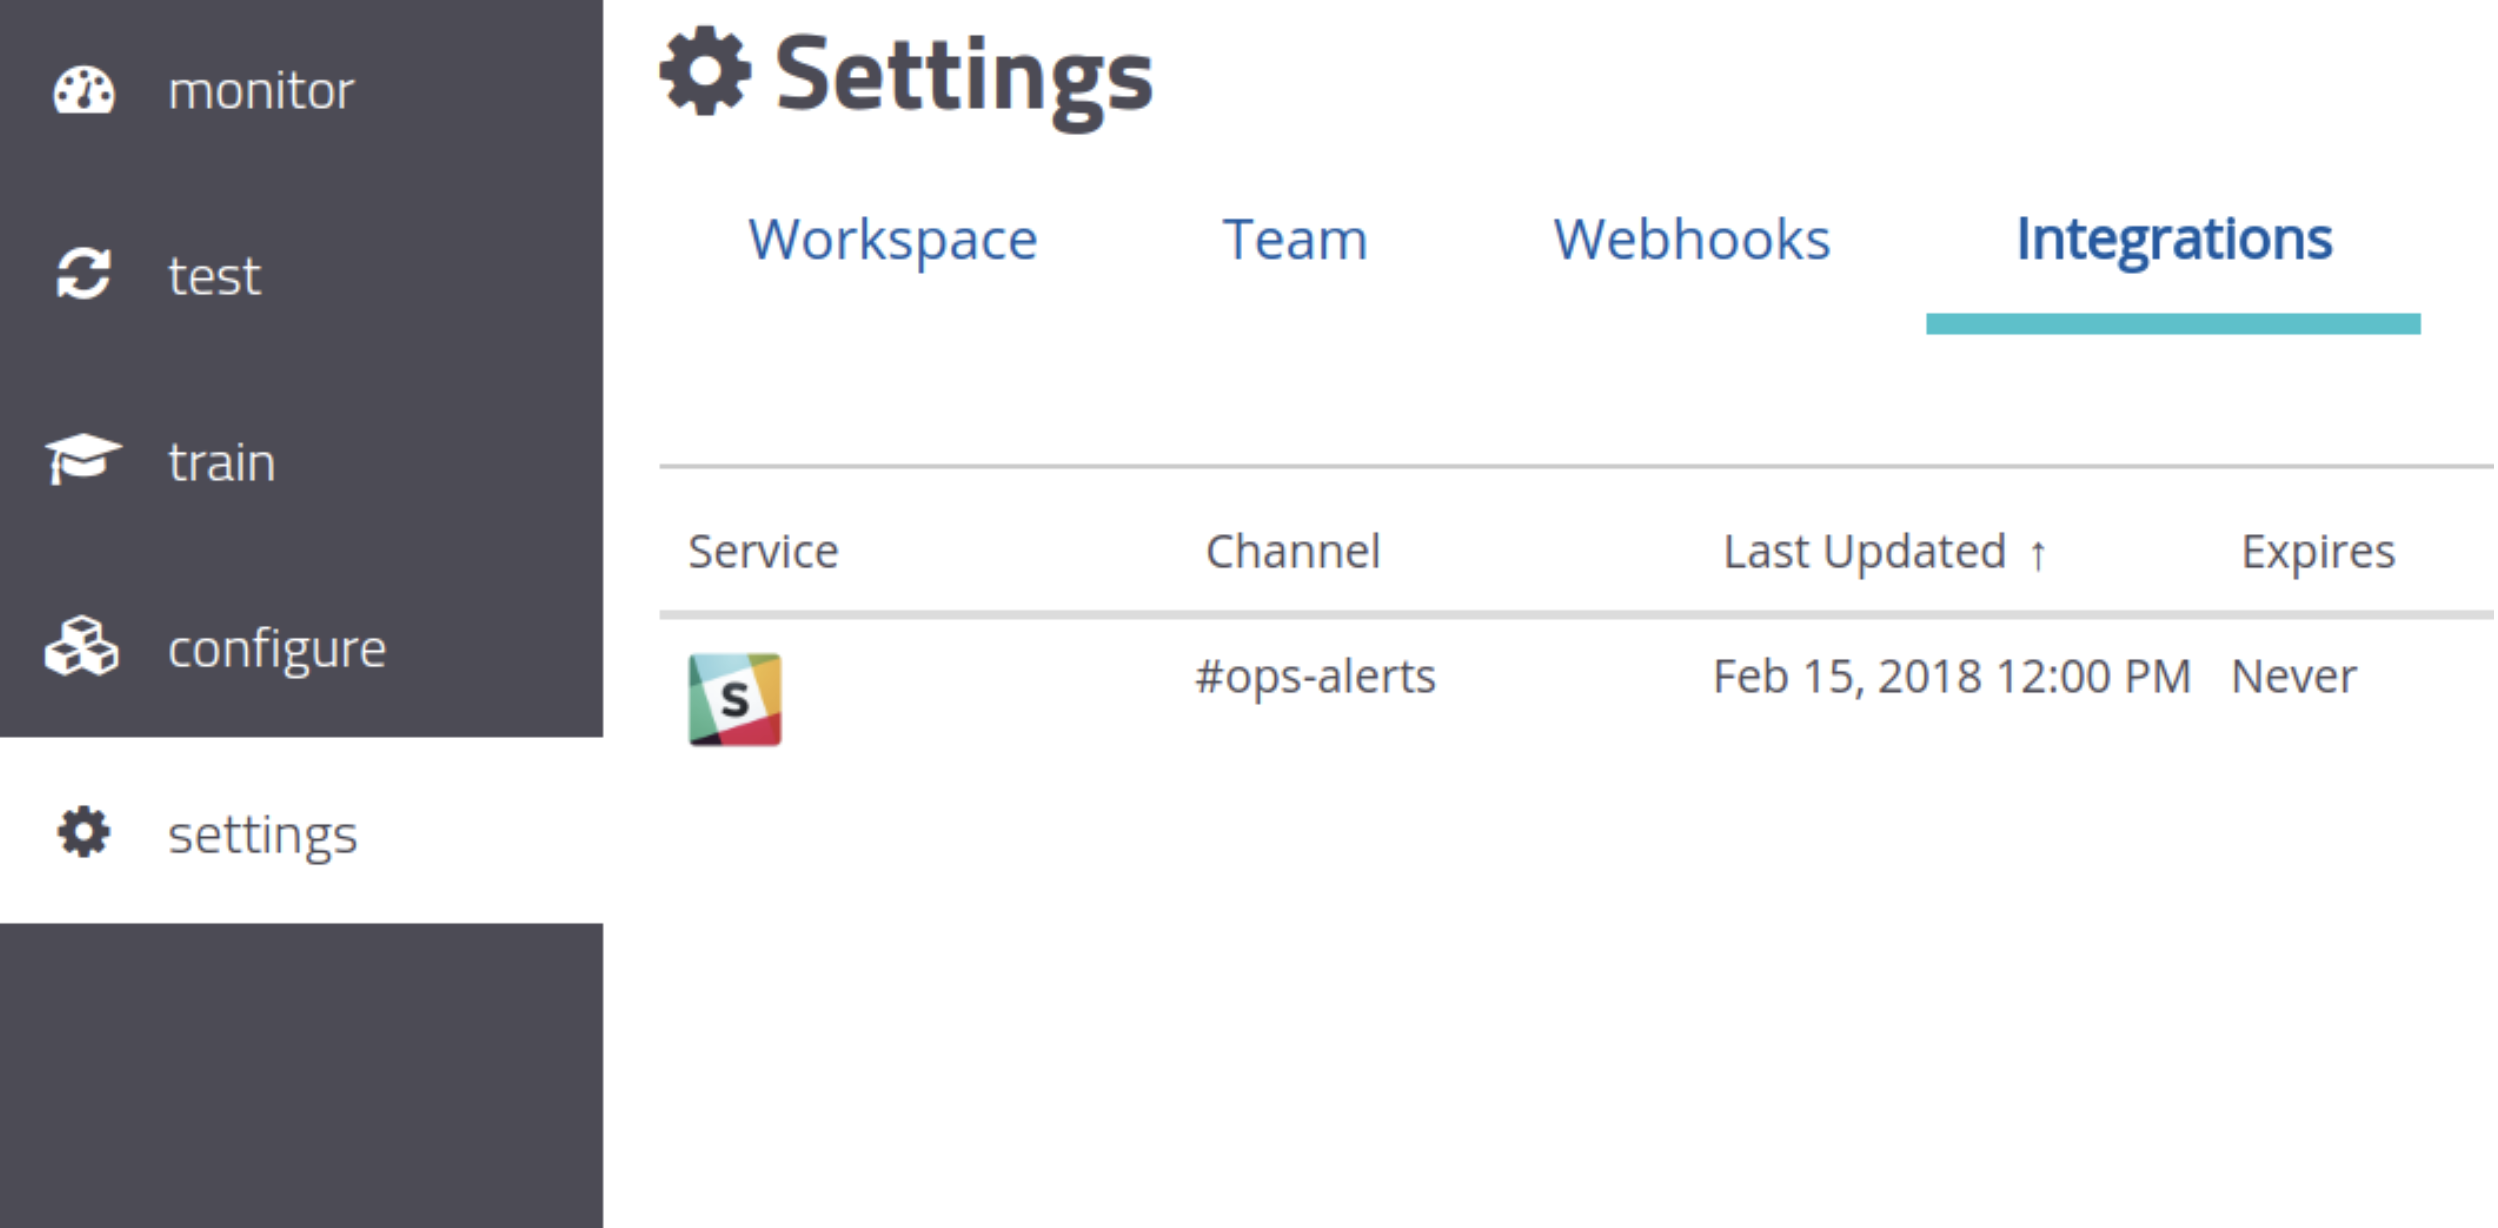
These slack channels are available to the entire team and are jointly monitored. Additionally, as part of our deployment checklist, any engineer who deploys code is required to actively monitor these channels after the release and respond to any regressions.
The slack channel works well for regression tests, image diffs, performance degradations, and broken links. But for the core smoke tests against production, we want to auto-create incidents and address them immediately. To do this, we use mabl webhooks to send test results to Google Stackdriver: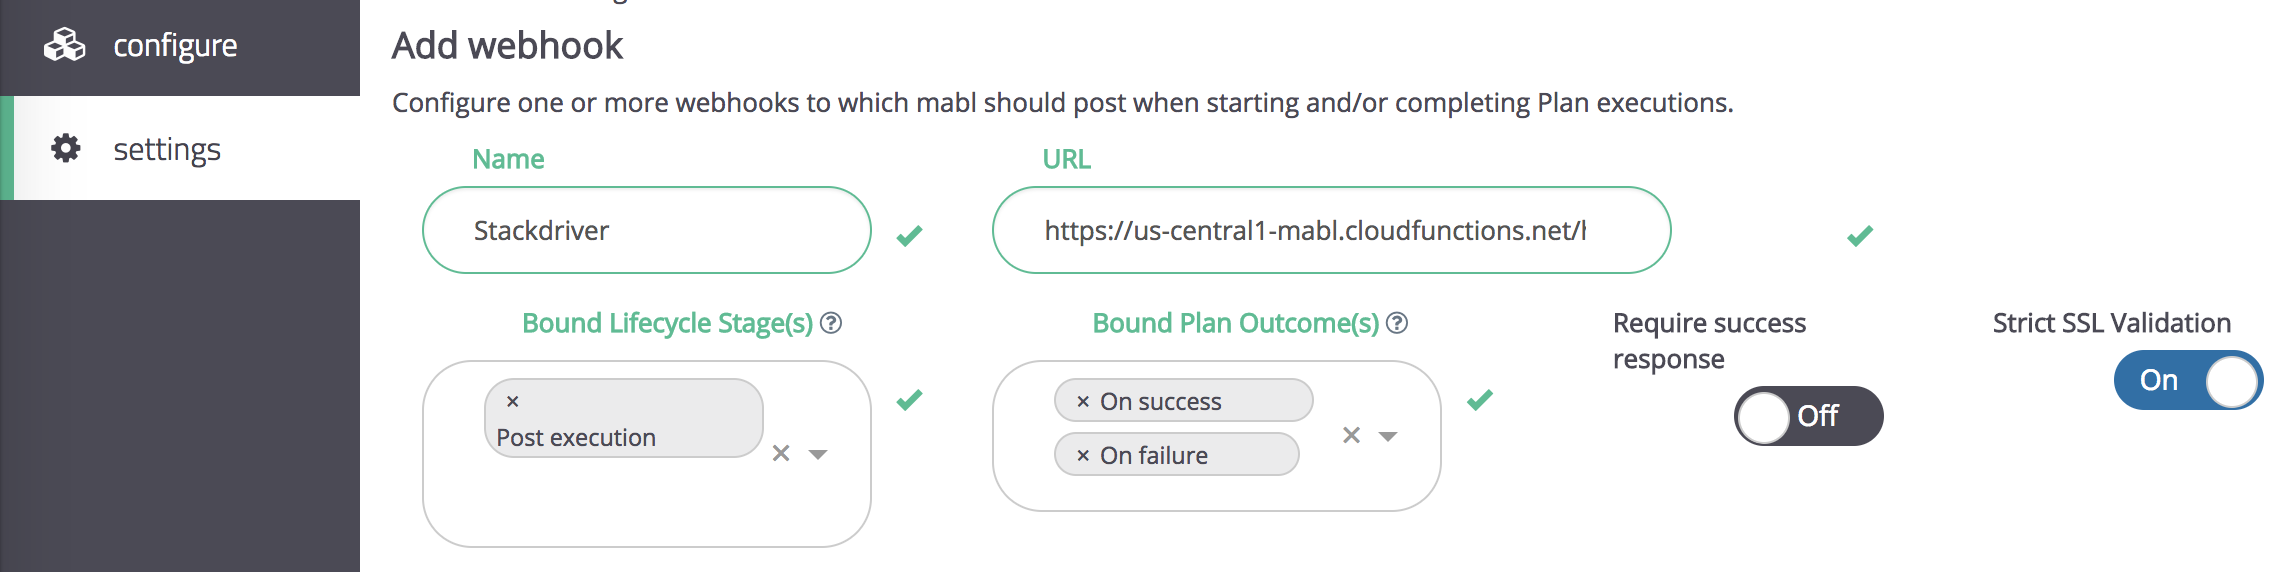
The webhook endpoint is backed by a Google Cloud Function with an http trigger. It receives the execution events post-execution and, using the ID of the plan, writes a custom Stackdriver metric that tracks a count of the number of failing journeys in the plan. The code and instructions for deploying the cloud function in your own google account are available on GitHub: https://github.com/mablhq/stack-driver-integration-demo
This pipes metrics for all of our plans to Stackdriver. We then define an alerting policy for the production monitoring plan in Stackdriver that fires whenever the count of failed tests goes above zero.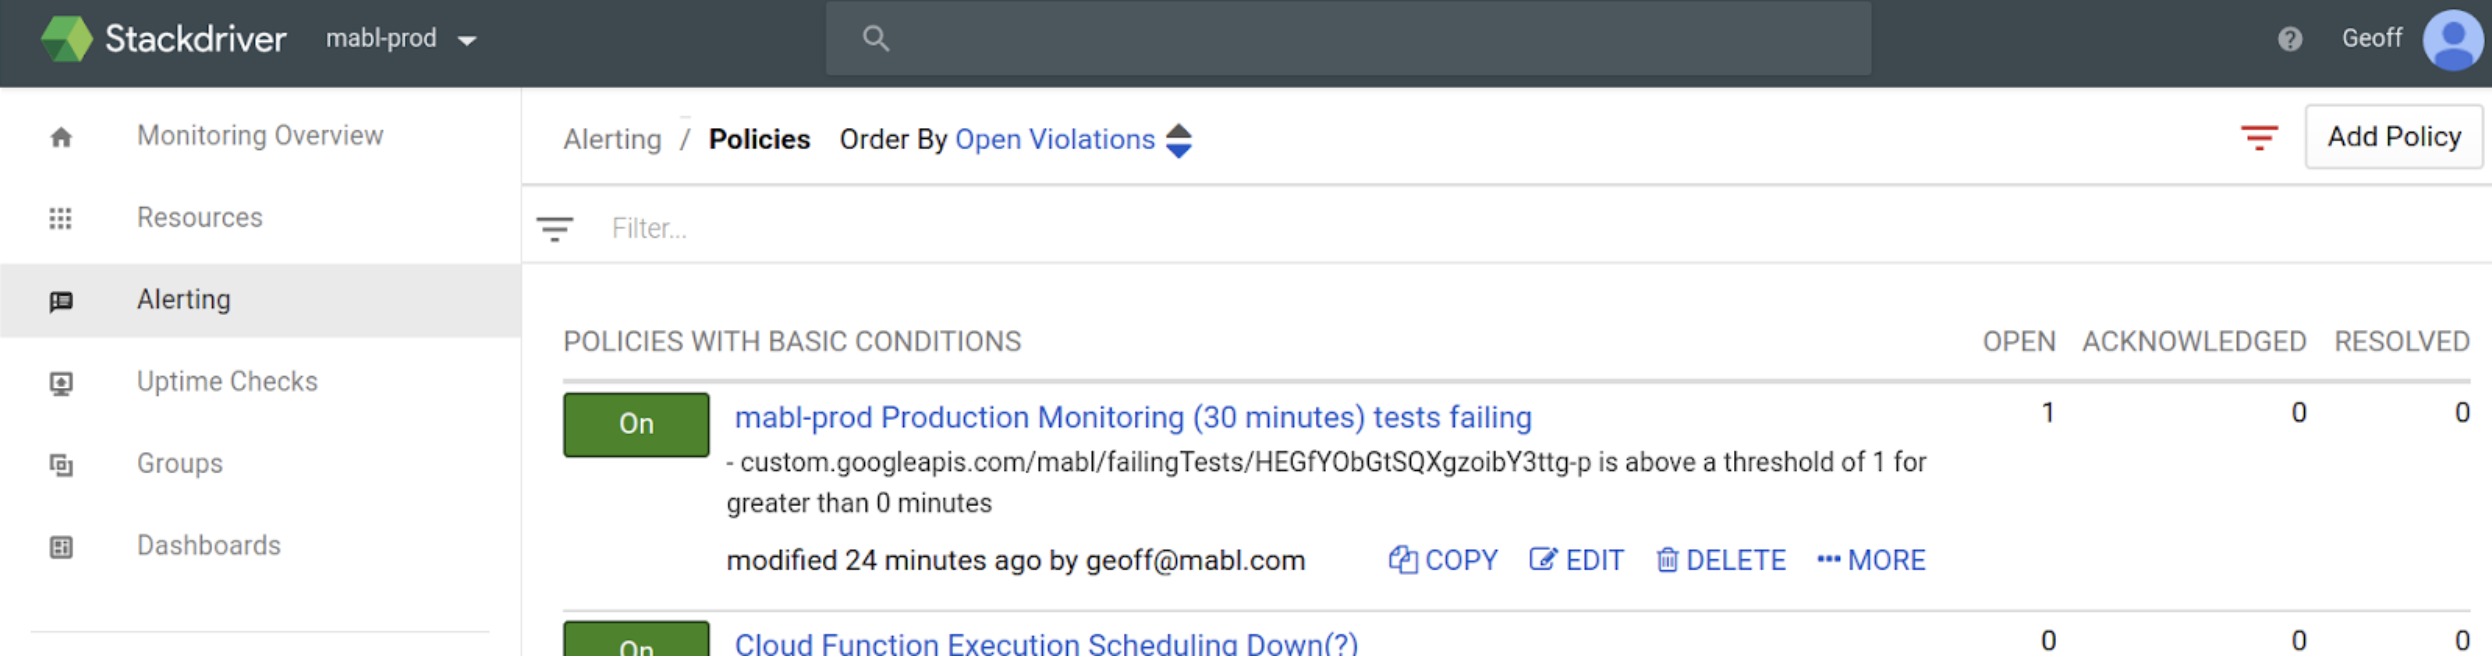
For on-call schedule management and incident escalation, we use OpsGenie with a primary and secondary on-call engineer. When Stackdriver creates an incident due to failing tests in production, it goes to OpsGenie who escalates to the primary engineer on call.
What's next?
For those who don’t want to use webhooks, we’re actively working on a couple of improvements to our public APIs and native integrations. On the API front, we will soon have an API to poll for test results related to a specific deployment. We’ll also be adding triggering deployment information to the webhooks API to make it easier to tie output back to specific deployments as well.
On the native integrations front, we are actively working on a native Jenkins plugin and tighter integrations for Bamboo and others are not far off!