
Our merged PR throughput went from 179 a month last August to 810 in April, roughly 4.5x in eight months. Our top engineers each landed 60 to 80 PRs in March of this year alone. We're not the only org seeing this curve, and you probably aren't either.
As AI accelerates code generation, verification becomes the limiting system. The operating choices about how verification scales are now load-bearing for the whole org, and are not simply a CI detail. Coding agents are structurally biased toward declaring their work successful; they're trained on signals that reward apparent completion, and they hand off to systems that have to decide whether the apparent completion is real.
The faster the generator runs, the more weight falls on whatever's downstream of it. If those layers don't scale at the same rate, the org doesn't get faster delivery; it gets faster claimed delivery, with the verification debt sitting on someone's desk.
What follows is the shape of the verification layer we built and the order the choices came in.
Four mabl capabilities turn out to be load-bearing across the rest of the post:
-
Two completely separate mabl stacks (one for production, one for development) that test each other so monitoring never shares fate with what it's monitoring
-
Browser and API tests in one toolchain (so a single regression run spans the contract and the UI)
-
An authoring path where engineers describe intent (via a coding agent, the CLI, or the mabl UI) and mabl generates the test, plus a results layer that helps us interpret what happened
-
An MCP interface that returns test results to coding assistants in a form they can reason over (Using mabl against itself also surfaces product issues)
Geoff Cooney's two-part series on how we ship code with agents across 75+ repos covers the coding-side infrastructure: cross-repo rules, the skill system, and AI code review. One side-effect of building that infrastructure was that writing down rules for the agent forced us to make them explicit for humans, too, so tribal knowledge that had lived only in a few senior engineers' heads for years finally got committed to a file.
This blog is about the verification side of the same stack. What our tests look like, how they're triggered, and how we built the shared substrate that lets engineers (and their agents) interpret what happened.
The numbers behind it
Deployment frequency has nearly doubled since last fall, while lead time improved as commit volume tripled. As our engineers pushed 300 commits/month to 800+, median time from commit to production actually dropped from 24 hours to under 20, revealing that the verification layer scaled faster than the generation layer.
 Production deployments nearly doubled
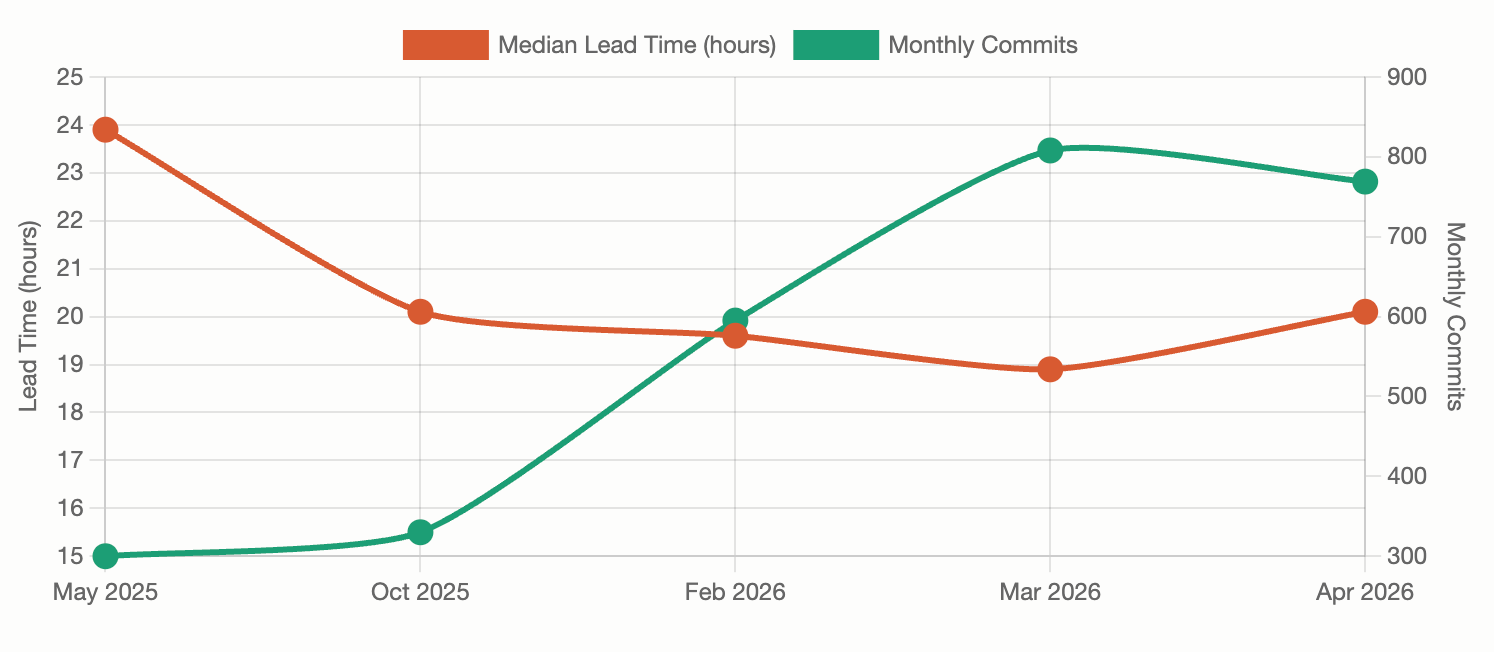
Lead time dropped as commit volume tripled
That's the point: if the verification layer doesn't scale at the same rate as the generator, the org doesn't get faster delivery. It gets a growing queue at whatever layer is slowest.
The shape of the stack
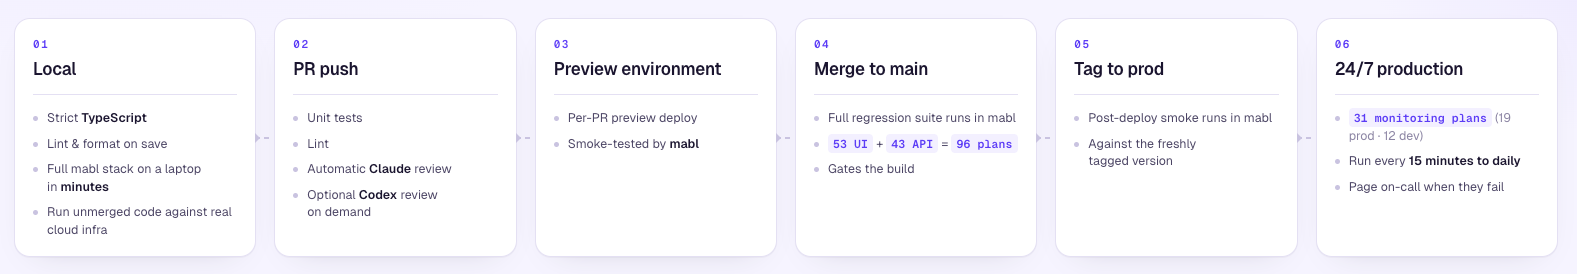
Every UI change at mabl passes through the same product four times before it reaches a customer, bracketed by two upstream layers that keep the cycle cheap.
-
Local — strict TypeScript, lint and format on save, a full mabl stack standing up on a laptop in minutes, and the option to run unmerged code against real cloud infrastructure
-
PR push — unit tests, lint, automatic Claude review, optional Codex review on demand
-
Preview environment — a per-PR preview deploy, smoke-tested by mabl
-
Merge to main — the full regression suite (53 UI plans + 43 API plans, 96 combined) runs in mabl, gates the build
-
Tag to prod — post-deploy smoke runs in mabl, against the freshly tagged version
-
24/7 production — 31 monitoring plans (19 in the prod workspace, 12 in the dev workspace), running every 15 minutes to daily, paging on-call when they fail
Strict TypeScript, generated API clients, and lint-on-save catch hundreds of trivially-correct decisions before a PR ever opens. A renamed field the frontend forgot to update, a switch statement missing a default case, an unused import that hides a deleted feature. Every defect that escapes locally costs a full PR cycle downstream. A CI run, an automatic AI review, possibly an auto-fix commit, possibly a preview deploy, to catch what a compiler would have caught for free.
The local stage also runs targeted tests. We've codified the test-routing logic as a Claude skill (.claude/skills/validation-router/SKILL.md) a markdown table that maps file paths to test commands at three escalating scopes: specific test class (seconds), related module, and full repo. Combined with rules in every repo's CLAUDE.md that direct the agent to run typecheck and relevant tests before committing, the practical effect is that most agent-authored changes get a scoped local test run before they ever push. A single class for a one-line fix, and module suite for a refactor. Push then triggers broader path-filtered CI, and the merge queue runs the full battery against the actual merge commit. We built the routing layer ourselves. It's a markdown table, not a product. The worst case is the 7-minute API build at merge. The everyday case is much faster, because the agent rarely runs anything broader than the slice it actually touched.
We run two completely separate mabl testing stacks — one in production, one in development — with their own infrastructure, databases, and cloud resources. Each stack has a workspace dedicated to testing the other stack: ordinary mabl workspaces that are no different from the ones customers use, except they're pointed at us.
On the production stack, the "mabl prod tests" workspace runs the heavy pre-merge regression. 153 active plans, including UI-regression and API-regression suites that fire on every PR preview deploy and gate every merge to main. On the development stack, the "mabl dev tests" workspace runs the post-tag smokes and the 24/7 production-monitoring fleet. 119 active plans that fire on every release to prod and on continuous timers thereafter, paging on-call when they fail.
A plan here is a configured run: a set of tests, an environment, browsers, a trigger profile (timer or deployment event), credentials, and labels. The two workspaces between them carry 272 active plans, executing roughly 1,100 individual tests when the plan-to-test fan-out is counted.
The architectural detail that matters: the stack running the tests is never the stack under test. Prod tests dev for new code, dev tests prod for releases. There's no separate monitoring tier to maintain. Each workspace just runs mabl tests the way any customer workspace does. An outage that takes out the prod stack cannot take out its own alerting, because the dev stack keeps firing.
Concretely: a plan called Unified Runner: Production Monitoring (Chrome P4H+D) 📟 24/7 runs from the dev stack, against the prod stack, paging on-call 24/7. The suffix encodes the trigger profile. P4H is "every four hours," and +D is "also on every deployment to prod." Plan names follow this convention across the fleet (P15M, P1D, +D), so an on-call engineer can read the cadence and triggers off the plan name itself.
Twelve plans in the dev workspace page on-call when they fail; most fire on the same dual trigger: scheduled heartbeat plus deploy events. The practical effect is that every release immediately re-validates against prod, and if no release happens, the timer keeps firing anyway. How fast we find a regression after a deploy is limited by how fast the test runs, not by the next scheduled tick. If the prod stack disappears, the dev stack keeps watching.
The bigger thing here is progressive disclosure. The MCP server now gives your agent access to the full power of mabl's agentic failure analysis and test recovery, but the way we've built it is that we're really thoughtful about the instructions we give the agents on how to use these tools. The agent doesn't dump everything on you at once. It surfaces what you need, when you need it, and escalates to deeper analysis only when the signal warrants it.
Why this works (and what's transferable)
Run the customer path, not a /health endpoint
Our most critical production heartbeat is a plan called EE - Canary Scheduling Test. Every 15 minutes, a browser test logs into mabl-prod through the actual UI. Typing the credentials, clicking the buttons, and navigating the same screens a customer would. This kicks off a canary test run, and asserts the run starts within a tight time budget. When the scheduler drifts, the canary can't be scheduled, it fails, and an engineer is paged. We learn about problems within 15 minutes, not when the support inbox fills up.
The test of "can mabl run tests" is itself a mabl test. A /health endpoint would tell us the load balancer is up, a customer-path test tells us the product is. The latter catches a meaningfully different kind of bug, though the cost is real. These canaries need the same care as customer-facing tests.
Make the validation cycle a budget, not a backlog
At 700+ PRs a month, with a top engineer able to land 70 in 30 days, a slow test suite stops being an inconvenience and becomes the bottleneck. The bottleneck just moves to whoever's waiting on CI. We've come to treat build time as a number that has to scale down as throughput scales up. Our API build went from over ten minutes to under seven by parallelizing Java and TypeScript. Our preview environments stand up in under three minutes.
We've watched what happens at smaller scales when CI is too slow. Engineers start working around it — merging on green-but-slow, skipping tests with flags, paying less attention to validation results when they finally arrive. None of this is malicious; it's what people do when generation runs faster than the layer that's supposed to check it. The fix wasn't a culture push, it was making the layer fast enough that there was nothing to work around.
A second opinion is one comment away
Every PR gets an automatic Claude review (Opus 4.5) on open. When the first review feels insufficient — high-stakes change, ambiguous diff, security-adjacent code — engineers can summon an independent Codex review (GPT-5.4) with a single /codex-review comment. We do this surgically, not on every PR.
In January, our team merged 428 PRs and posted around 1,500 review events, roughly 3.5 reviews per PR, almost entirely human. In April, we merged 810 PRs and posted over 2,300 review events combined, with the agent contributing nearly half of them. The shape of the change isn't, "humans replaced by agents." It's "review capacity grew at the same rate as PR throughput, because the agent grew alongside." Without that, 800+ PRs in a month would have crushed the human queue. With it, throughput nearly doubled and reviews-per-PR held steady.
Different model families have uncorrelated blind spots, and making the second opinion one comment away means it actually gets used when it matters.
The shift this is moving us toward is "humans become the exception, not the default reviewer." Of the 810 PRs we merged in April, 62% had at least one human approval, 31% had the agent as the sole reviewer, and 2% merged with no review at all. Roughly one in three PRs is now flowing through the agent-only path. We watch the failure rate of that population closely; if it climbs, we adjust where the threshold sits. As one of our engineers put it bluntly in Slack, "We can't move at this pace while also having humans review every change." The end state is humans looking at the PRs the agents flagged or the engineer chose to escalate, and the routine majority flowing through with one agent review and one human glance.
Heavy internal use is the most honest product feedback loop we have
When an engineer breaks a mabl-on-mabl test, fixing it is just part of shipping the change. Our #mabl-on-mabl-testing Slack channel is a constant stream of, "I'm about to merge X — MoM tests might need retraining, I'm on it." The part we didn't see coming until we were a year in was that every awkward retraining flow, every confusing failure analysis, and every screenshot artifact that takes too long to load gets felt by an engineer who can file a Jira ticket against it. A lot of the improvements that shipped in the last year, like better failure analysis, in-flight healing when the page has drifted, and faster preview-environment runs were shaped by friction we hit ourselves alongside what customers were telling us. Customer support tickets surface what's broken. Using the product surfaces what's annoying, which is a different and often more useful signal.
Treat the test suite as a portfolio, not an artifact
Test maintenance backlog accumulates without active work to keep it down. We've seen this in our own codebase. Tests that hadn't passed in days, still wired into our regression suite, are still being mentally filtered out by reviewers. The discipline that keeps mabl-on-mabl credible is treating the suite itself as a continuously maintained product, with the same quality bar as the code it tests.
Builders own tests; QE does suite engineering. Software engineers, PMs, designers, and our founder author and maintain mabl on mabl (MoM) tests directly. When we ship a feature, we ship its test. When we break a test, we fix it, publicly, in the dogfood channel. Quality is the same person who shipped the change, not a separate team that gets to it eventually. Our QE team is part of this, but their work is a level up. Looking at the suites as a whole, watching the data, finding coverage gaps, surfacing optimization opportunities, codifying best practices, and developing new testing strategies for agentic, non-deterministic systems where the right approach is still being figured out. They aren't catching up on in-sprint automation, they're the people who keep the test-suite-as-product credible at scale.
Tests compose; they aren't flat scripts. A test that exercises performance-test creation calls a reusable named flow ("Start flow: App - Perf test - Add single functional test") rather than re-encoding the steps. Login, navigation, common workflows, each lives once, in one flow, and every test that needs it inherits the implementation. The same is true of snippets, credentials, environment variables, and queries: each is defined once and referenced everywhere it's needed. When the login UI changes, we fix the login flow once and the rest of the suite picks up the fix automatically. This is the test-suite equivalent of DRY, and it's the answer to the obvious objection that 272 plans sounds expensive to maintain. They aren't 272 independent scripts; they're a graph of shared building blocks.
Flake isn't a binary; it's a containment hierarchy. Three escalating layers handle non-determinism. During execution, mabl can heal a step in flight when the page has drifted in small ways — a moved button, a renamed input — and continue the run instead of failing it. The run heals, the saved test definition is unchanged, and an engineer decides whether to update it. If a run fails anyway, plan-level auto-retry runs it once more; the merge gate tolerates the failure if the retry passes.
Tests that fail persistently land in a Quarantine plan that runs but doesn't block the build, while their owners triage. mabl's results view ties these layers together. It shows when a run was healed, when it retried, and when a quarantined test is still failing, so the team can see what's transient and what's real. Each layer has a clear escalation path, so signal doesn't decay into noise. The alternative most orgs default to is one-bit decisions (skip or don't), which destroys signal over time.
Plans are self-describing. Every plan name encodes its cadence and paging profile in suffix tokens — (P4H+D) means every four hours plus on every deployment, (P15M) means every 15 minutes, 📟 24/7 means it pages on-call all hours, 📟 wrk hrs means business hours only. Every label is typed by purpose: cicd-* for plans wired to CI triggers, feature-* for product surface area, team-* for routing failures to the right Slack channel, monitoring and ops-alerts-paging for synthetic vs. paging tiers.
An on-call engineer who sees a failed plan knows from the name and labels alone what tier it's in, who owns it, and how to route it. The artifact is self-describing. There's no separate alerting-config file or out-of-band documentation.
Coverage extends past functional regression. Five accessibility plans run axe-core against the mabl web app, marketing site, and sandbox on every regression cycle. Ten performance plans run continuously, including a perf smoke on every per-PR preview deploy, so we catch performance regressions before merge, not in a periodic load-test window.
Coverage and quality are measured, surfaced, and pruned. We watch flake rates, pass rates, and per-test quality scores. Tests with 0% pass rate over 30 runs get triaged or disabled, not left to rot. We also run explicit browser-upgrade validation: when Chrome ships a new stable, our dev workspace runs a regression suite against the new version before we expose any customer test to it. The directive I sent the team last quarter still applies: "Take a mabl 2026 view of every test you touch. Can I generate this? Can it function more like a tester and less like a script? Can I replace 10 hard-coded DOM assertions with a single gen AI assertion?"
Every deployment is a fix loop that runs in the assistant
After every deployment (to preview, to dev, to staging, to prod) an engineer or their coding assistant pulls the deployment's test results directly into the assistant's session. Our MCP server connects mabl directly to Claude Code, Codex, and any other MCP-aware coding assistant. It exposes a set of deployment-keyed tools designed to be chained:
get_recent_deployments (filter by commit SHA, across any environment)
get_mabl_deployment (what failed for this deploy)
analyze_failure (structured Root cause + Next steps)
get_test_run_artifact (screenshots, HARs, DOM snapshots returned inline as base64 the assistant can render and reason over)
get_test_recovery_session (when mabl auto-healed a step during execution, what selector or fallback it chose, and why)
We detailed this workflow in From merge to root cause — without leaving your coding agent, showing exactly how an engineer uses these tools in practice.
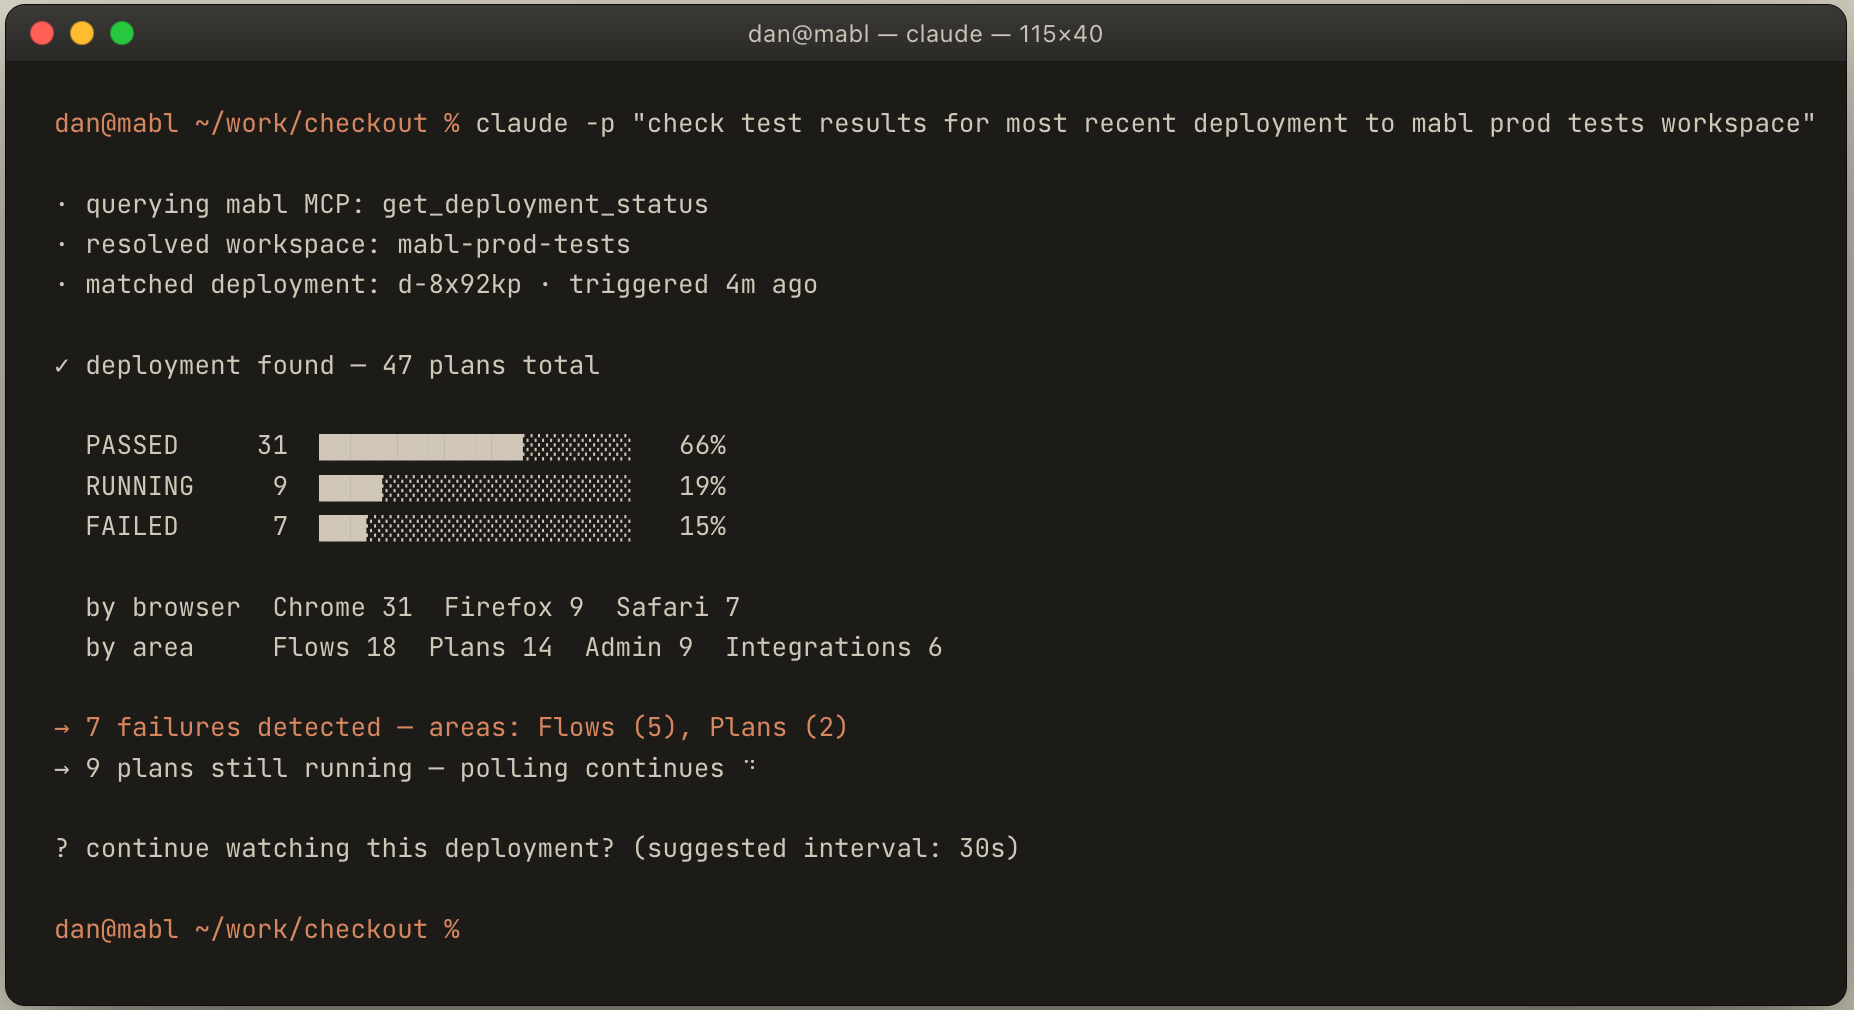
Concretely, an engineer pushes a commit, the preview environment deploys, and within a minute they ask their assistant, "What happened with my last deploy?" The assistant chains those tools: pulls the failed run, fetches the analysis, fetches the screenshot, correlates it against the diff just pushed, and proposes a fix.
And after a few iterations:
The MCP workflow in action: from deploy question to root cause analysis in a single assistant conversation
All of it in the same console session that wrote the change. The same loop runs again when the change deploys to dev, and again at staging. Most failures get caught and resolved long before they could ever page on-call. By the time a change reaches production, the assistant-resident loop has run against it three or four times.
The shape we ended up with: observability designed for the coding assistant to consume, not the human to read. Tool descriptions written for agents (with "use when," "don't use when," and "follow-up" guidance). Artifacts returned inline rather than as opaque URLs. Each tool explicitly chains into the next. We didn't set out to build observability for agents. We built it for engineers, and over time the engineers' assistants became the primary readers.
What ties it together
The seven layers — author, local/preview, CI, AI peer review, merge queue, pre-prod regression, production monitoring — predate agentic development. Agentic coding hasn't replaced any of them. It's added a new layer at PR review time, dramatically reduced the cost of every other layer, and added an eighth layer where every deployment cycles back into the assistant's context as agent-readable signal.
But layered defense only works if the layers are independent. The two-stack split, the second-opinion option from a different model family, the production heartbeat that exercises the customer path rather than a proxy for it, each of those exists because we wanted layers that catch what the others miss.
The other through-line worth naming: at this throughput, no single decision-maker can sit at every gate. The system splits decisions three ways. Agents handle the small ones: which tests run before commit, the first-pass PR review, chaining MCP tools across a deploy failure to surface a likely fix. Humans handle the consequential ones: whether to escalate to a second model family, whether to ship the agent-only PR, where the failure-rate threshold sits.
And in between, a routing layer: the scoped Claude skills that pick which tests to run, the /codex-review summons for a second opinion, the self-describing plan names and labels that tell on-call what they're looking at. The routing between agents and humans isn't an afterthought, it's part of the stack.
At AI-native throughput, the verification layer is the system. The decisions about how it scales, what runs locally vs. in CI, which model reviews what, where humans sit, and how production failures get back into the assistant's context, are no longer engineering hygiene questions. They're the system's organizing principles. We made these choices over about eighteen months, mostly in response to pain. Naming them might save the next team some of the rework.
Three questions for your verification layer: Does it scale at the same rate as your throughput? Do failures get back to the engineer who can fix them? Can you catch regressions without adding headcount?


